Dynatrace has expanded its Synthetic Monitoring capabilities with a new Network Availability Monitoring feature. Using ICMP pings, TCP port checks, and DNS tests, it’s now possible to monitor the status and availability of network infrastructure and services around the clock.
Users gain insights into their infrastructure via Network Availability Monitors (NAMs) that go beyond traditional HTTP and browser monitoring. The new feature also provides deeper visibility into network and transport layers. Dynatrace offers this NAM functionality for both Dynatrace Managed and SaaS versions of its solution.
For Dynatrace Managed, this includes
- A powerful API for creating and managing synthetic tests
- A set of metrics that allows users to explore query results using the Data Explorer and create advanced reports with Dynatrace dashboards
- Basic reporting available immediately, offering insights into key metrics describing monitor executions and highlighting which requests may cause outages or slowdowns
Enhanced Network Monitoring with Automatic SNMP Device Discovery
Dynatrace has also introduced a new autodiscovery extension for its network monitoring solution. This enables the automatic identification of SNMP-connected devices on the network and their inclusion in an inventory list. The extension is easy to implement. Through integration with the Dynatrace platform, extended monitoring capabilities are available, including alerts when defined thresholds are exceeded.
A typical setup could look like this:
- Define the scope of IP subnets/ranges
- Install the SNMP Autodiscovery Extension
- Configure one or more IP subnet/range groups
- Set global parameters, scan frequency, ActiveGate group, and number of parallel discovery processes
- Select one or more IP subnets/ranges to define the scan scope
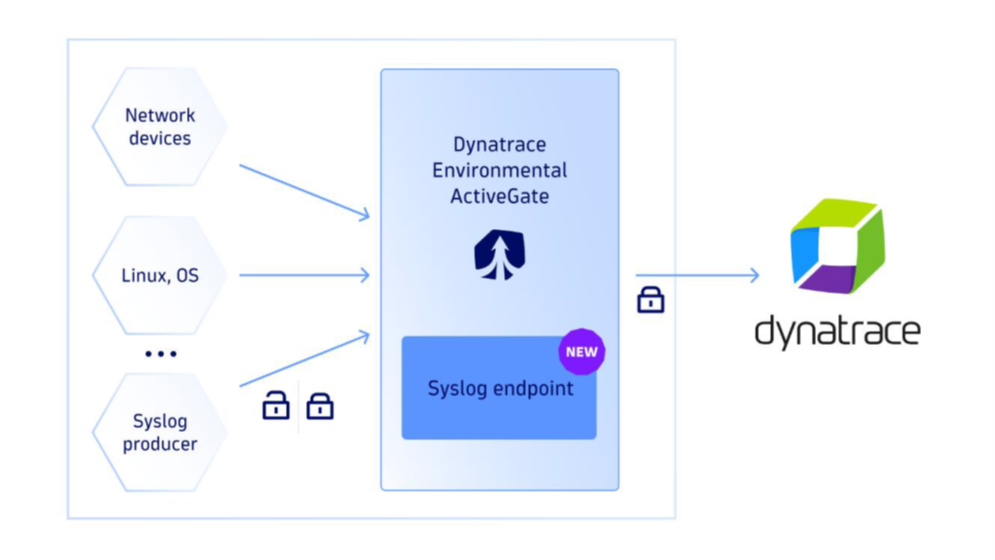
Improved Syslog Data Monitoring with Dynatrace ActiveGate
With updates to the ActiveGate component (from version 1.925), Dynatrace now supports secure integration and real-time analysis of Syslog data. It offers flexible endpoint configuration and streamlines contextualization within the Dynatrace platform. Manual correlation is no longer required, allowing issues to be identified and resolved more quickly. This leads to faster response times for operations teams.
To benefit from this enhanced monitoring, simply set the parameter Syslogenabled=true in the extensionsuser.conf file. No restart is required. To complete the setup, the syslog producer must send the data to the appropriate Environment ActiveGate using the correct IP address and port.
Dynatrace Red Hat OpenShift on IBM Z and LinuxONE
Dynatrace has also extended its platform capabilities to provide full-stack observability for Red Hat OpenShift on IBM Z and LinuxONE mainframes.
This offers deep insights into the current state of the network infrastructure and application performance.
Using the Dynatrace Operator, organizations can automatically detect and analyze performance issues, improving operational efficiency by gaining better visibility across their entire technology stack. This supports the modernization toward hybrid cloud environments.
The Dynatrace Operator accesses the following resources:
- Dynatrace OneAgent is deployed as a DaemonSet to collect host metrics from Kubernetes nodes
- Dynatrace code modules, activated via webhook, enable distributed tracing and code-level visibility for applications deployed in Kubernetes
- Dynatrace ActiveGate is used to route and monitor Kubernetes objects, collecting data (metrics, events, status) from the Kubernetes API
Resulting benefits include:
- Automatic instrumentation of Red Hat OpenShift infrastructure (control plane and worker nodes) and workloads, but without manual code changes
- Configurable instrumentation scope, for example by namespace
- Automatic and secure lifecycle management of Dynatrace components (e.g., ActiveGate and OneAgent)
Discover the Benefits of the Latest Dynatrace Features
Take advantage of the extended monitoring capabilities such as Network Availability Monitoring, enhanced SNMP device discovery, and the new Syslog data management to monitor your infrastructure more effectively and boost operational efficiency.
Contact us today to learn more about these new features and find a tailored solution for your needs.