amasol | Your pathway to digital success
Availability: in itself quite simple and yet surprisingly complex
This article was written on the basis of a presentation by Hans Maurer. The co-founder and former member of the amasol management team is now a freelance IT problem solver and continues to advise amasol as an external principal consultant.

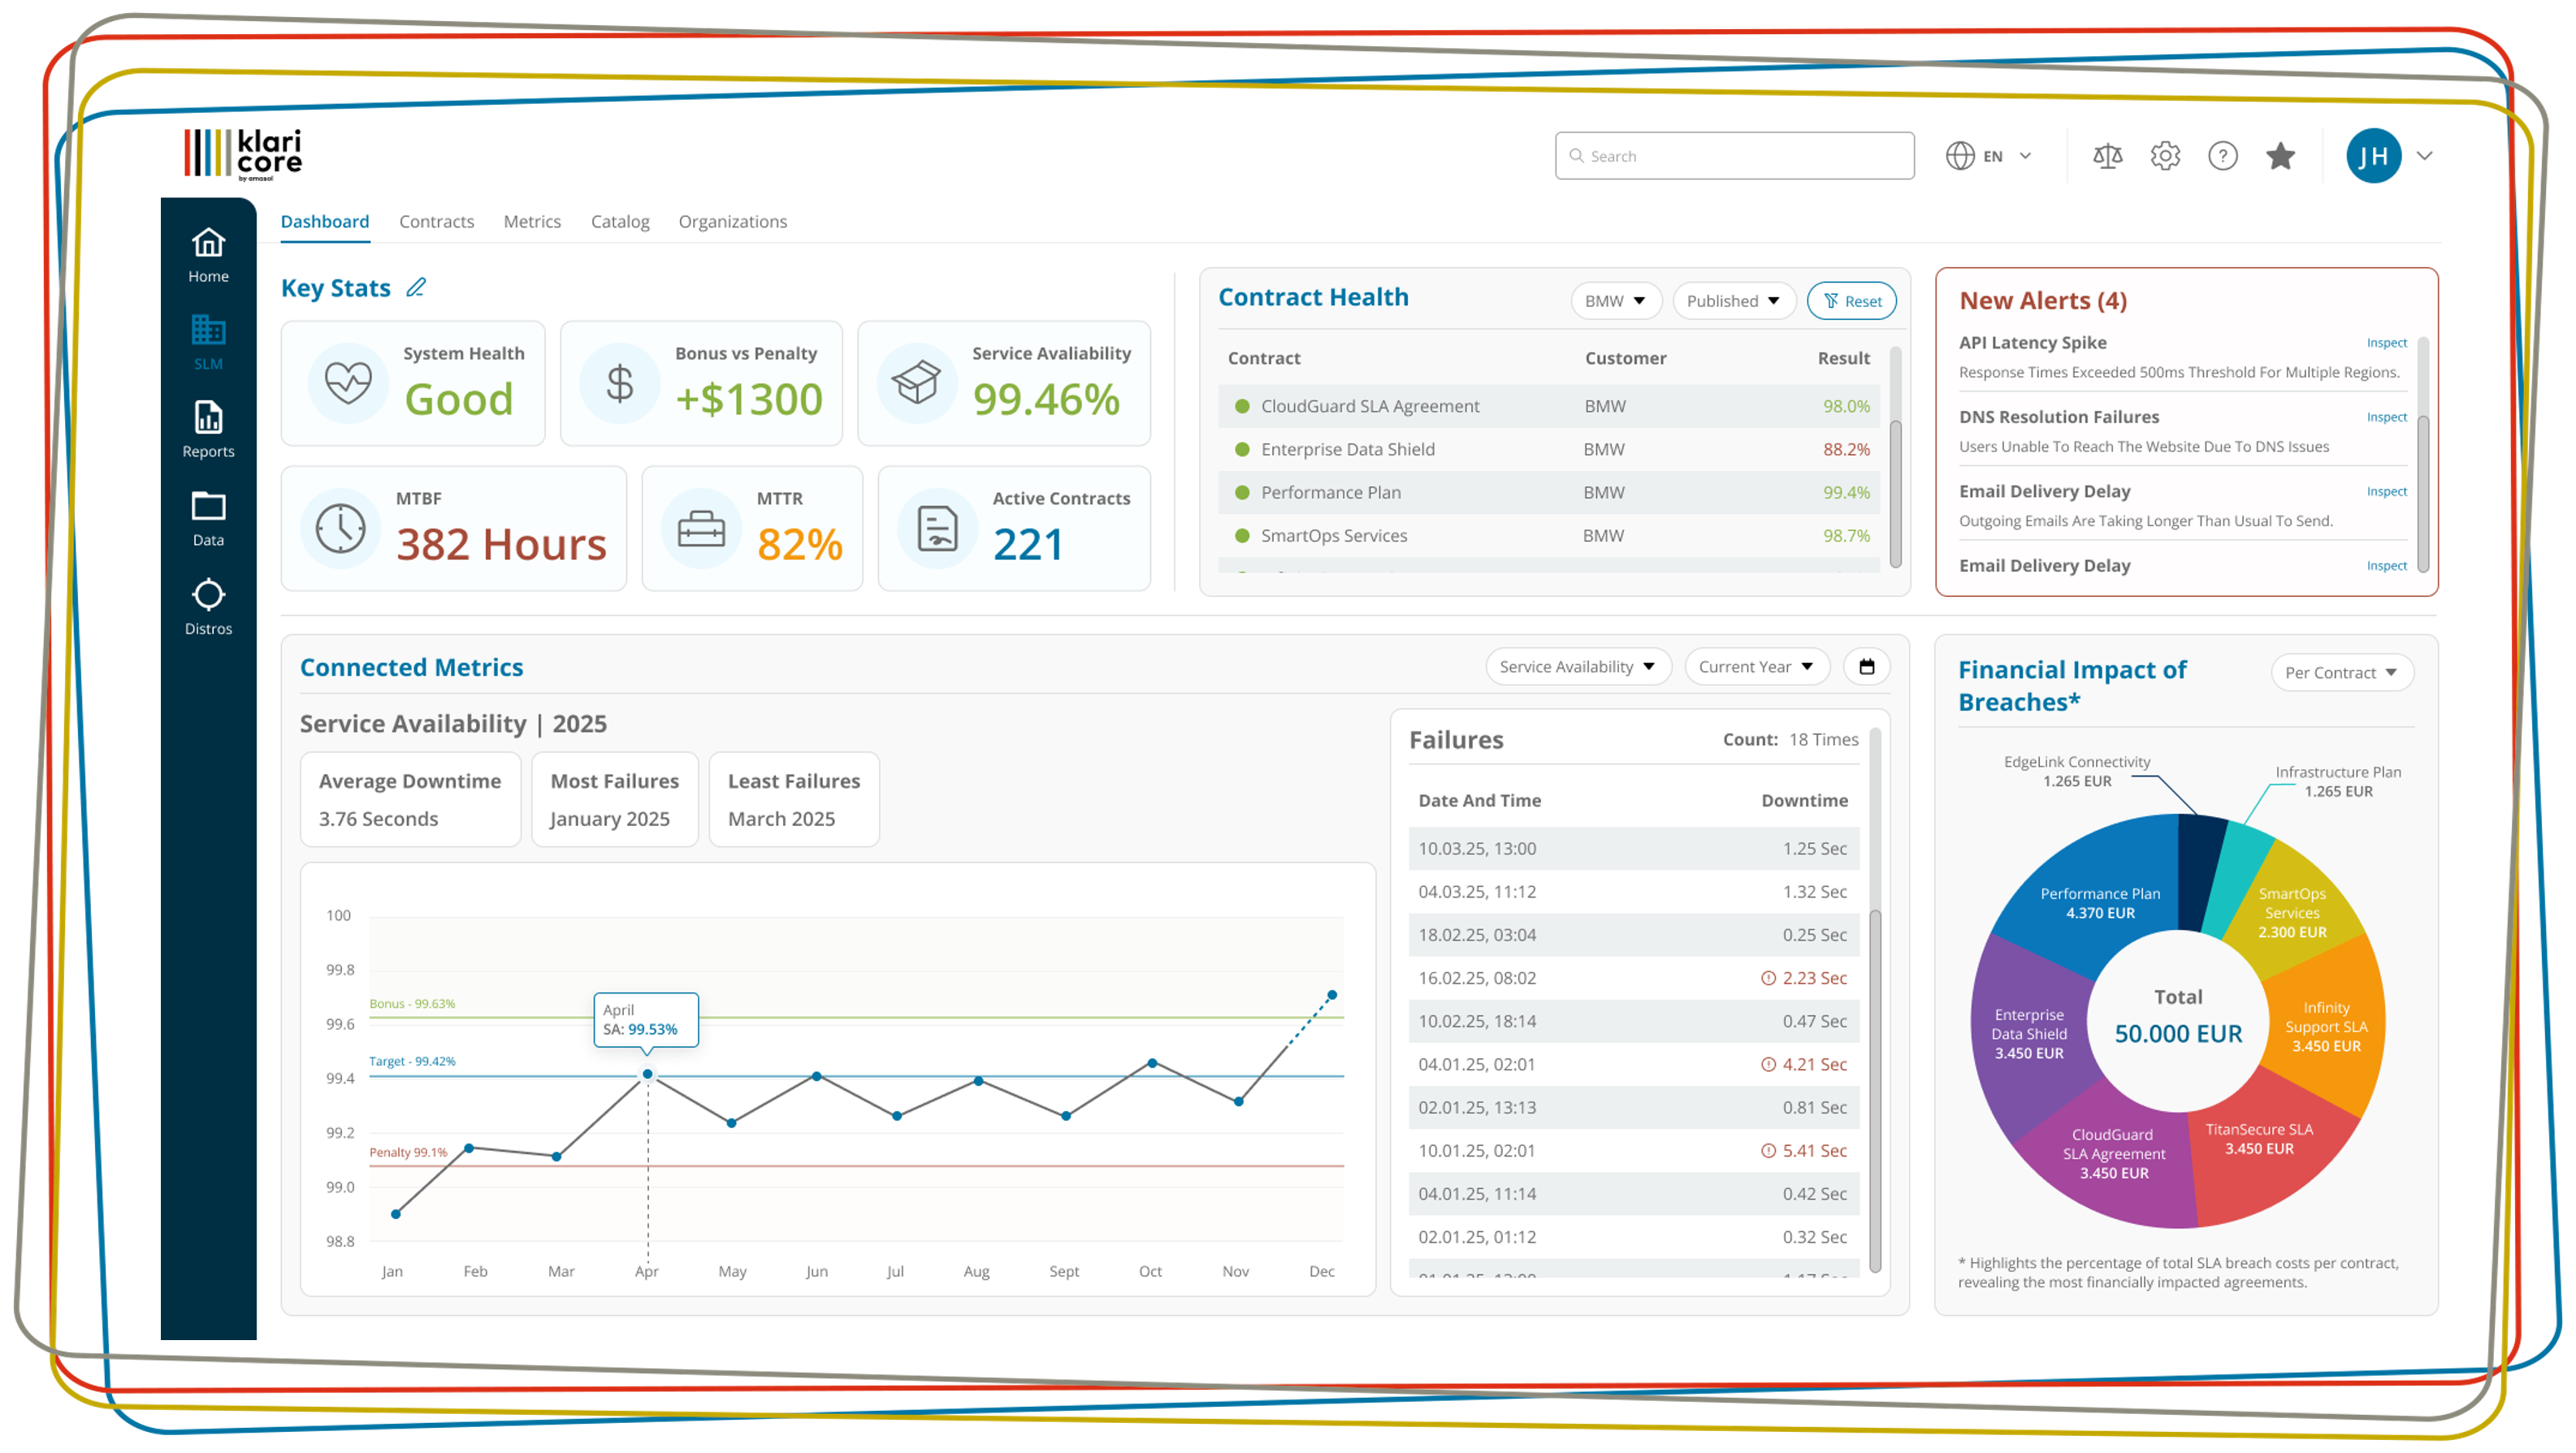
Key figures and reporting period
Why is “availability” so important today?
Availability is one of the central metrics for the quality of a system or IT services. After all, business processes such as production or logistics are no longer possible without IT – and a system failure often brings the entire company or parts of it to a standstill, production downtime and lost sales.
Availability also plays a role in the evaluation of an IT department. As an “IT service provider,” it is responsible for keeping systems running. And – like external IT service providers – it must prove that the levels of availability specified in service level agreements (SLAs) have been maintained, otherwise it must justify why not. Availability is ultimately the basis for billing for the IT systems and services provided.
Proving availability is a key issue when internal and external service providers and their customers work together.
Availability – what is it?
The term is easily defined. According to Wikipedia, “the availability of a technical system […] is the probability or measure that the system will meet certain requirements at a given time or within an agreed time frame. […] It is a quality criterion and a key figure of a system.”
For its calculation, this results in the formula:
availability = (total time – downtime)/total time
This is calculated as a percentage:
availability = (total time – downtime)/total time × 100 %
This calculation of availability is widely used. As a rule, it results in values of over 99 %. Systems for which an availability of 99.99 % or more are referred to as “highly available”. The significance of these key figures in practice is illustrated by the following examples: For a system that is to be available 12 hours a day, on 5 weekdays, 52 weeks, an availability of 99 % means a maximum downtime of 31.2 hours. However, for a system that is to be available 24 hours a day, 365 days a year, and is to achieve an availability of 99.999% (“Five Nines”), a maximum downtime of only 5.26 minutes comes into question – in the entire year!
There are also a number of alternative metrics that occur less frequently:
• Number of individual failures
• Maximum duration of individual failures
• Cumulative failure time
These metrics come into question in the case of a “single point of failure”, the component of a higher-level system whose failure causes that of the entire system. The number and duration of failures play a central role in the evaluation of availability. A single failure lasting one hour, for example, can have a different impact – on the productivity of the entire system – than 60 failures lasting one minute each.
The reporting period – second important metric
Another metric is the reporting period for which availability is measured. The use of systems or services is usually billed on a monthly basis. Shorter (per day) or longer (per quarter, per year) periods are rare. A short reporting period may be considered for a single point of failure. In the report, the monthly values with their target are often supplemented by a graphical representation of the daily values. This also allows the customer to see the distribution of downtimes. A longer period makes sense if the importance of the system is lower or it is rarely used. A common value here is “Year to Date”, the calculation of availability in the current reporting year up to the current date.
Data sources and results
Final results or detailed data
Data and measured values for calculating the availability of an IT system or service usually come from two sources. Either “final” values in percentages are supplied or raw data is available for calculation. Ready-made results can be collected manually or automatically using a monitoring system. The manual method is useful for isolated systems. Monitoring tools are usually used. However, not all of these tools have data interfaces for automatic integration of relevant data. In that case, manual effort is also required to supplement the measured values collected from different systems for a plausible final result.
A special case is when an IT service provider not only provides its own services, but also acts as an intermediary for third-party services. If it has agreed service level agreements (SLAs) as a general contractor, it is responsible for ensuring that its subcontractors deliver the performance data so that it, as the contractual partner, can prove the availability of the system. The method of determination is also specified in the contract. This can lead to complexities, because the methods of the “intermediary” and those of its suppliers must be specified. Furthermore, all data should come in on time so that reports are ready at the agreed time.
Components, services, tickets – sources for detailed data
If an availability report is based on a company’s own calculations, then the question arises on which basis the data is collected. The status or failure data for IT components often comes from a wide variety of infrastructure management systems, and in rare cases it is also collected manually. The methods of collection and the formats in which data is prepared are as varied as the monitoring systems. Common methods are the regular recording of status values, such as checking availability every minute, or the evaluation of downtime lists (event logs). Availability per measurement interval can also be used as an evaluation criterion. This shows whether a system or component was available continuously or only intermittently (as a percentage) during a specific period.
Due to the numerous different systems, methods and formats that are generally used for monitoring and recording availability data, the results must be converted into a defined standard format. This is the only way to produce a valid and comprehensible statement on overall availability.
Detailed data for IT services
The situation is different when it comes to collecting detailed data for IT services such as e-mail, CRM or SAP. For such complex services, the data of individual sub-services is often correlated to produce an overall result. There are various methods for doing this. One option is single point of failure, when the failure of one component threatens the entire service. Systems in which essential components are available several times over, the redundancy method is the best option. Availability is assumed when at least one of the components is available. A further method for correlating the component detail data is the Quorum. It is used for example with terminal server farms. Here an availability can exist by definition already, even if half of the servers are available.
Correlation structures are also important when calculating the overall result. These can be simple, fixed structures, such as system – cluster – server – process, which represent the overall service.
In the case of more complex services such as SAP, there are often multiple service trees containing sub-services, which in turn provide correlated results from external data sources.
Availability data is also collected from a user perspective. Measured values from end-user experience management or application performance management systems are used for this purpose. These perform synthetic measurements via monitoring agents for the permanent recording of comparable values. The calculations are made by aggregating parallel measurements on several clients to produce an overall result. Here, too, the correlation methods described are used to evaluate availability.
Real User Monitoring (RUM) records the behavior of active users. Gaps occur, for example, when no one is currently working with the system. In addition, the measured values depend on individual user behavior. Compared to synthetic measurement, RUM is therefore very well suited for other measurements such as abort rates or the proportion of successful transactions.
The user has the floor: detailed data from support tickets
Another option for calculating availability is to evaluate automatically or manually generated incident tickets from the IT support or user help desk. In manual processing, individual tickets must be assigned to respective components or services. This is not easy, because the user only reports the incident; the service employee has to find the affected components and services. Another challenge is assigning tickets to reporting periods, because the lifecycle of a ticket can span a period of several weeks or months. It must be clear whether and how open tickets are included in the availability calculation. In addition, it should be defined whether changes to active tickets have a retroactive effect on the results of a reporting period that has already been completed.
Failure of measuring devices: Courage to fill the gap?
It must be clear how data gaps are to be handled. After all, measuring devices may fail at any time or results may not be available for other technical reasons. It must be decided whether such gaps are assessed as “available”, “not available” or “not measured” in terms of performance and whether they lead to a reduction in service time, which in turn affects the calculation of availability. It should also be clear whether a minimum length of individual outages plays a role in the calculation. For example, outages below a certain length might not be considered.
There are a variety of data sources as well as methods and formats that can be selected for availability calculation. However, in order to make a valid statement about the availability of the IT system or IT service, this data must be correlated by mutual agreement and converted into a standard format
Availability: simple in itself, yet surprisingly complex
The title of this article was chosen carefully. On the one hand, everyone thinks they know what the term “availability” means. On the other hand, it often only becomes apparent in practice that the formula “availability = (total time – downtime)/total time” alone is not enough. As amasol’s practical experience shows, the devil is often in the details.
So it is no wonder that there are a wide variety of regulations, data sources, measurement methods, presentation formats and procedures for creating reports. Contractual partners must agree on who measures and records what, when and where, because this is the only way to create valid data that ensures that joint measures can be taken to optimize the availability of IT systems and services in the long term.
Correcting and commenting
Subsequent correction and commenting of the results
Once the consolidated results on availability are there, it may be necessary to make corrections. Usually, the values are checked again if a (supposedly too) unexpected result has been calculated – which is below the target agreed in the SLA. It is also necessary to comment on the figures, especially if corrections do not lead to a better result either.
Serious corrections are possible on the final result and on the detailed data – both before and after their normalization. In which phase of the normalization and calculation process corrections are made differs from project to project. In general, however, it makes sense to decide on a procedure, as otherwise the correction process becomes confusing and not transparent.
The best method is manual correction. This is done by the service supplier or the specialist department, the service management, the availability management or the customer management. The person or department responsible for the systems should also evaluate the results. Often this is not possible. Then the process takes place in a cross-departmental or cross-company team. It is very important that the input is collected, jointly discussed, evaluated and finally released. This applies to corrections and comments.
An automated correction method consists of evaluating change or incident tickets as well as lists of maintenance intervals. For example, system failures during ongoing changes are not relevant for the calculation of availability and must be factored out. The incidents must be correctly assigned to the corresponding components, services and contracts.
The effects of the corrections on the calculation of availability vary. In this way, downtime can be reduced, which has a positive effect on the result. Sometimes it is necessary to break down failures into individual phases that are relevant and not relevant for the calculation, for example if a failure extends beyond the agreed change period. It is possible that corrections lead to a reduction in operating time, which can also affect the final result.
Multidimensional view by condensing individual results
Meanwhile, the volume of reporting data collected on a monthly basis has reached a level that makes it almost impossible to evaluate all the data. Moreover, management usually prefers a simple traffic light system. Therefore, a serious summarization of the results must provide a quick overview of the current situation and the possibility to drill down to lower summarization levels in critical cases.
The condensation of individual results takes place along different hierarchies:
• From the Service Level Objective (SLO) to the complete contract
• Along technical structures (IT systems, services)
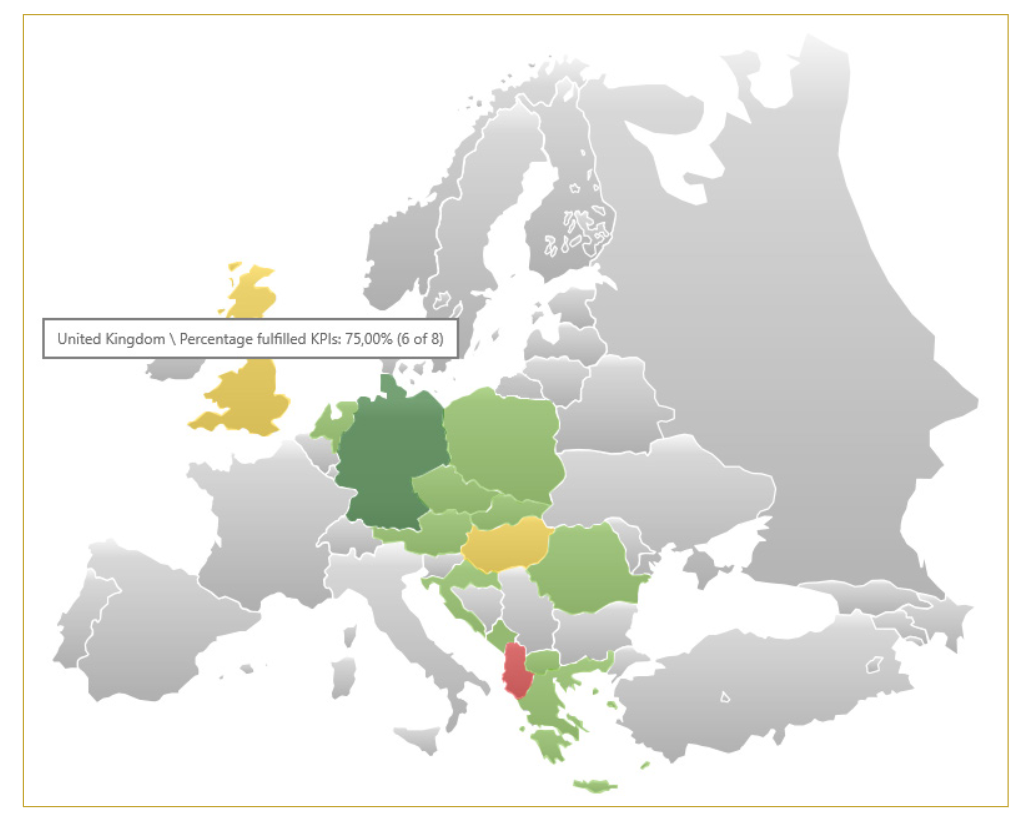
• Along geographical or organizational structures (locations, departments, customers, etc.)
Methodologically, the summarization can be done by calculating weighted averages. Another way is to calculate the number of violated or fulfilled SLOs. Of course, a combination of several methods is also possible. If required, missing values, for example if services are not available in certain regions, can also be taken into account and “padded”.
Correction, commenting and summarization of the individual results in different ways – these steps increase transparency for customers and service providers. Summarization leads to a multidimensional view of the results from different perspectives and according to different evaluation criteria. If the availability of services per customer and site is determined, the cross-site and cross-customer comparison of individual services is of interest to service managers, but the cross-service and cross-customer comparison of sites is of interest to site managers.
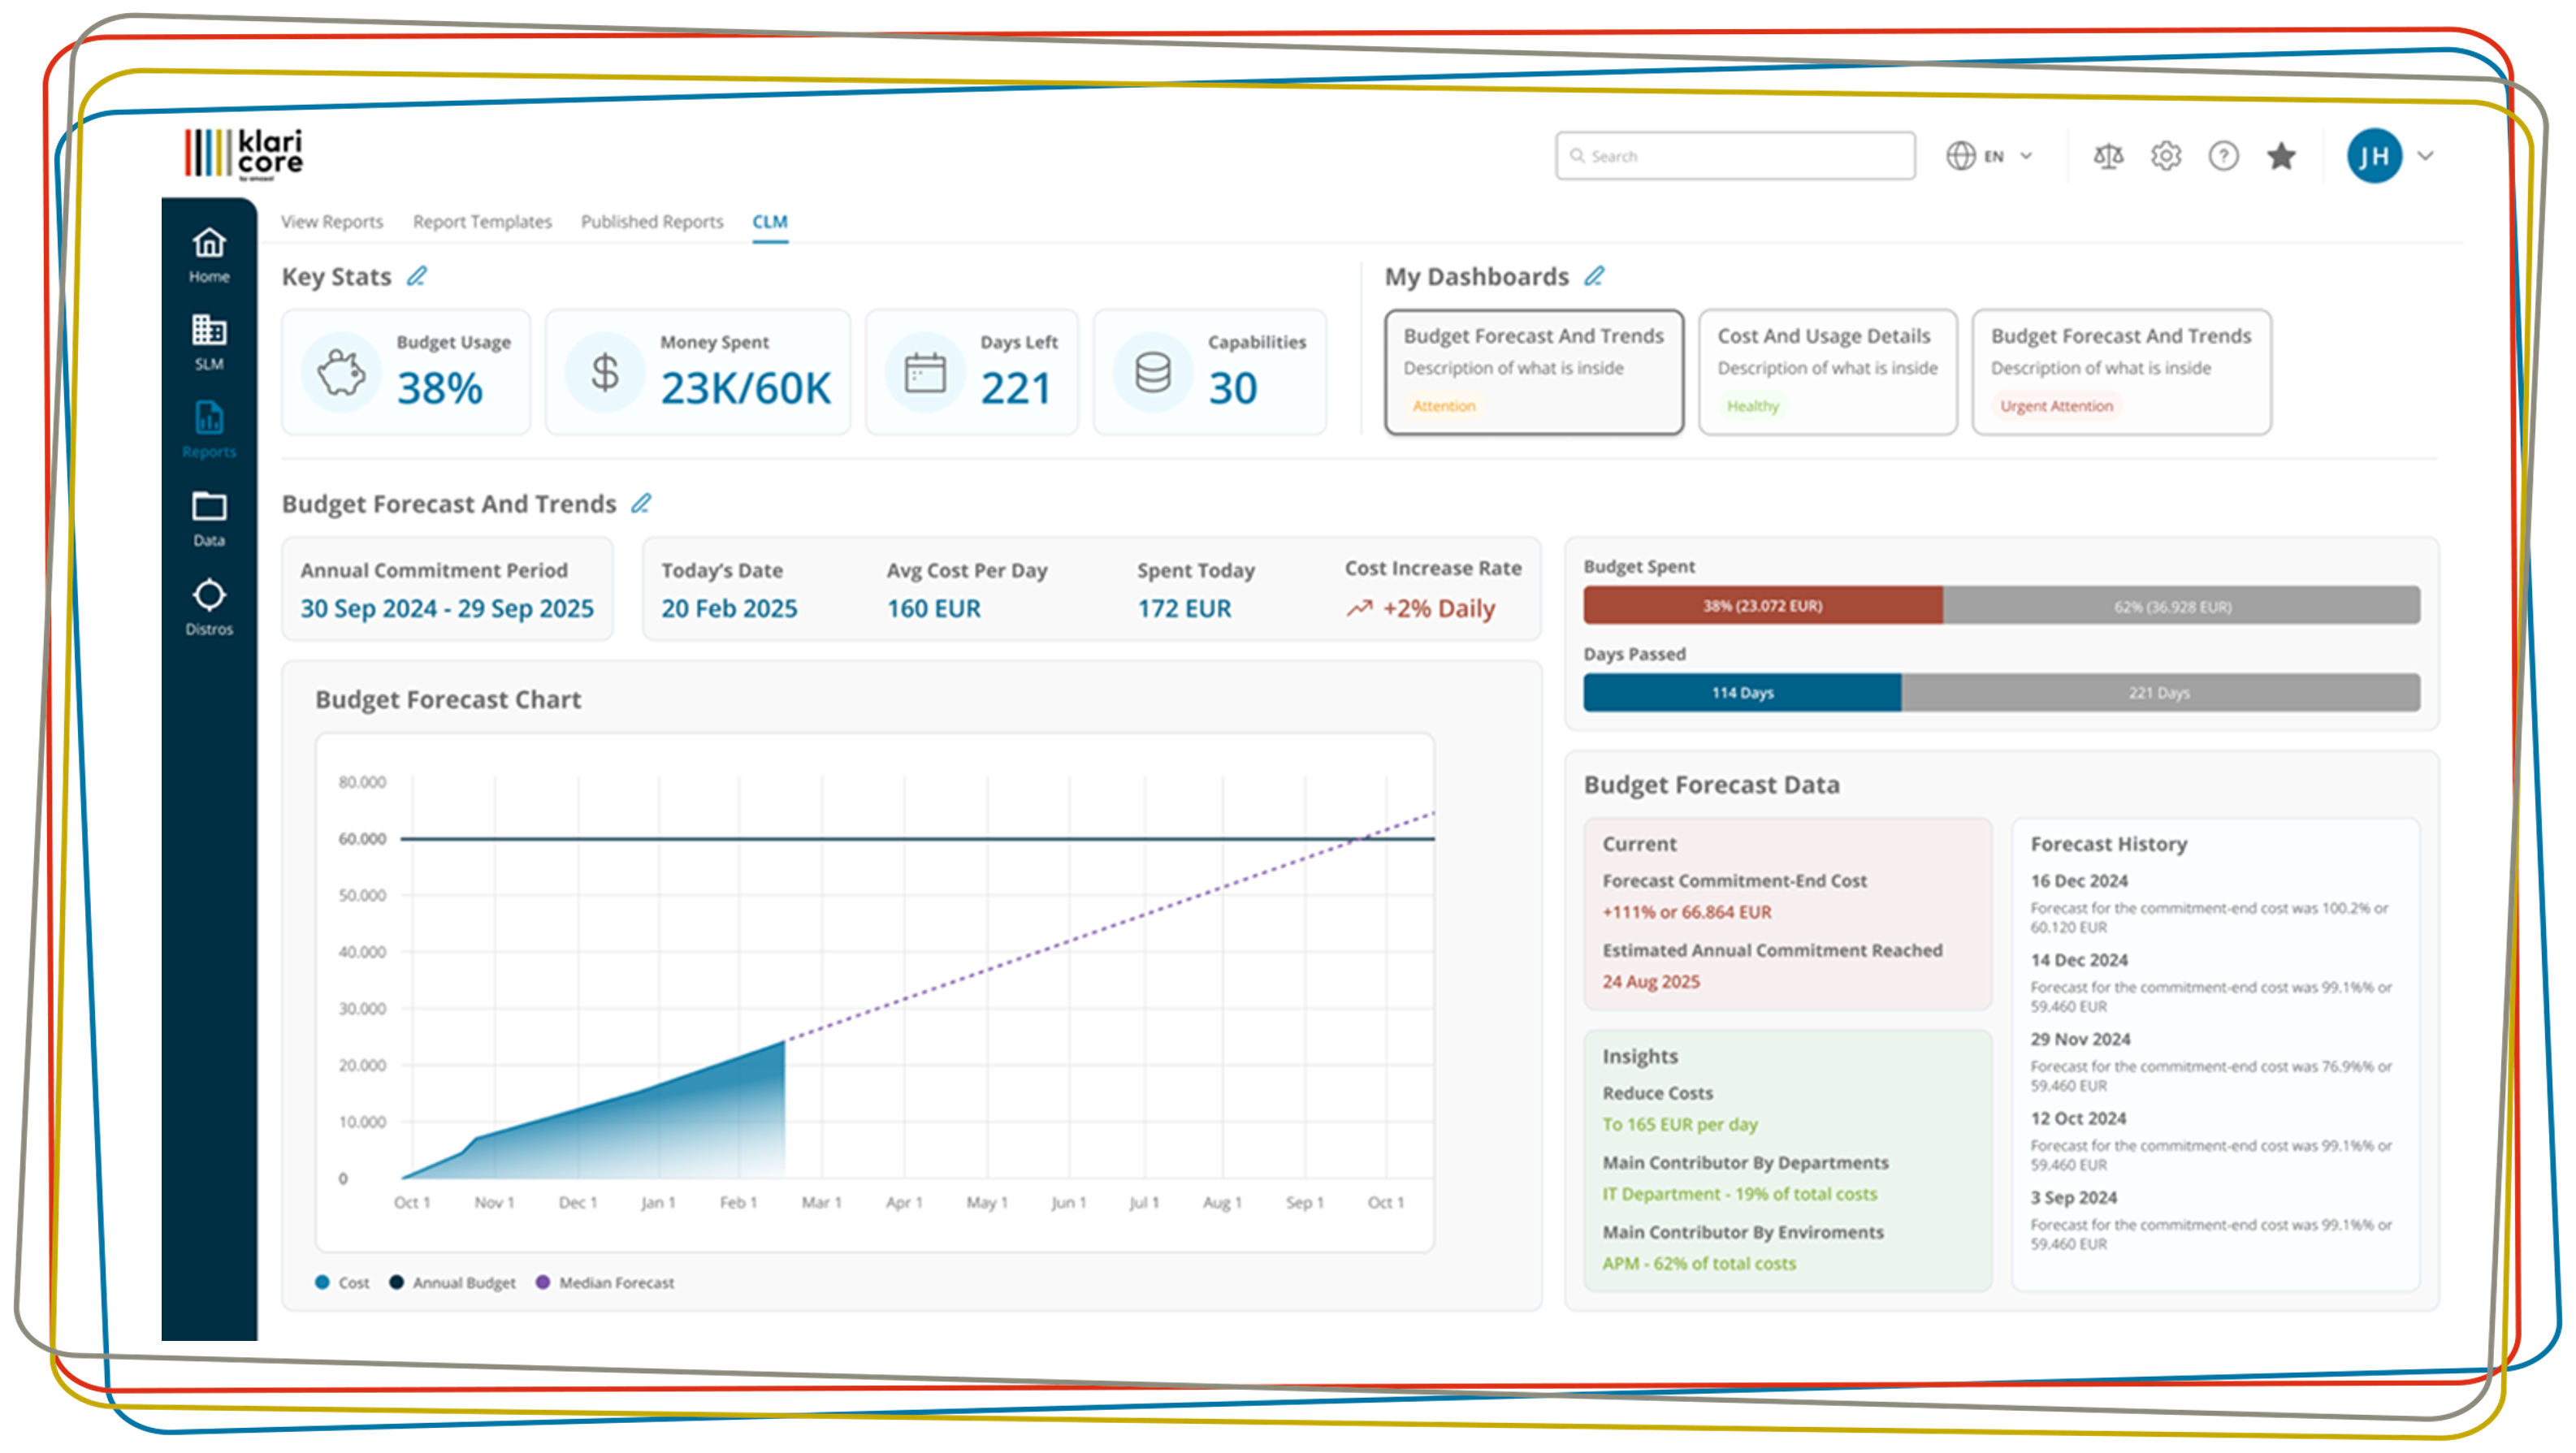
Frequently, the results of the availability calculation are also used to implement the bonus-malus rules defined in the SLA and to calculate the corresponding penalties. In an ongoing reporting period, the calculation also provides important input for the proactive management of systems and services. In this way, forecasts (best case, worst case) can be made on the basis of available interim results, on the basis of which measures can still be taken in good time if necessary.
// IT availability is critical to success: a system that works 365 days a year around the clock is to achieve an availability of 99.999% and may only have 5.26 minutes of downtime. Throughout the year!//
Hans Maurer, co-founder of amasol and expert in technology business management
Discover more about amasol

Our expertise
Benefit from over 25 years of deep expertise and high-quality service delivery across our key areas

Resource center
Search through our library of resources for inspiration on how amasol has helped other customers to power their experience business.

Our tools
Explore the tools and partnerships that help us drive success and optimize your IT environment.

Why amasol
We aim to increase agility, increase the value proposition and improve the efficiency of IT and thus increase business success.
amasol
Additional Resources
Legal Information
Copyright © 2025 amasol.com

MUNICH
Campus Neue Balan
Claudius-Keller-Straße 3B,
81669 Munich, Germany

VIENNA
Gertrude-Fröhlich-Sandner-Str. 2-4, Tower 9,
1100 Vienna, Austria

NEW DELHI
13/24 2ND FLOOR
West Patel Nagar New Delhi
110008 India

LONDON
60 St Martins Lane Covent Garden,
London, WC2N 4JS, United Kingdom