amasol | Your pathway to digital success

amasol miniature world with a home-office desk, and a crunched up paper wiith a tent and a sharpened pencil

Nagios, Icinga & Co.

A Guide to IT Infrastructure Monitoring with open source tools

As part of DevOps initiatives, digitalization projects and cloud migrations, many customers are investing in application performance management (APM).

The aim is to increase customer satisfaction and the associated revenue growth, which can be achieved through faster release cycles and the resulting reduced time-to-market with improved software quality. It is often assumed and also suggested by the manufacturers of APM solutions that this can be achieved with the purchase of the new tool.

However, as our experience shows, this is not a realistic approach. The added value of APM can only be fully realized and an ROI achieved if the necessary processes for constantly updating and improving the APM process are established and anchored in the company.

IT Infrastructure Monitoring solutions – challenges and selection

“No functioning business without functioning IT” – the current situation in most companies can be reduced to this simple denominator. Today more than ever, the basis for the successful operation of an increasingly complex IT environment is how well IT is able to continuously gain as comprehensive an overview as possible of the current status of the IT system and identify problems and incidents before they affect the user experience or lead to a failure.

The focus here is on the IT Infrastructure, the backbone of IT, on which all other IT processes run – and from whose failure all IT processes based on it are also affected. This guide deals with two central questions about IT Infrastructure Monitoring:

1. How can successful monitoring be achieved in modern, heterogeneous and complex IT infrastructures?

2. What support do open source tools such as Nagios or Icinga offer?

IT Infrastructure Monitoring: importance for the operation of modern IT environments

The greater the importance of modern IT Infrastructures for the smooth running of company processes and the customer experience, the more important efficiency IT Infrastructure Monitoring.
The reasons are obvious:

Optimizing IT Performance: As the importance of modern IT Infrastructures for a company’s success increases, so do the challenges for IT Performance. Professional IT Infrastructure Monitoring provides important insights into the performance of the IT system continuously and in real time and identifies areas and opportunities where and how this performance can be optimized. By monitoring important KPIs such as CPU usage, memory usage, network traffic and response times, IT is able to identify optimization potential or adjust the configuration to increase the performance of the overall system.

Proactive detection of problems: IT Infrastructure Monitoring enables companies to identify vulnerabilities and potential problems before they affect critical systems or services. By monitoring different IT components such as servers, networks, applications and databases, IT performance bottlenecks, security vulnerabilities or hardware failures can be detected at an early stage and corrective measures can be taken proactively.

Troubleshooting and problem solving: If problems or incidents do occur in the IT Infrastructure, IT Infrastructure Monitoring provides valuable information to get back “online” as soon as possible. It helps to determine the scope and impact of an incident, localize the affected components and collect relevant data for analysis. This is crucial for root cause analysis and enables IT to fix the underlying problems and prevent similar incidents in the future.

Capacity planning and scalability: Data from IT Infrastructure Monitoring forms the basis for forecasting the further development of resource usage and therefore future resource requirements. KPIs such as storage usage, network bandwidth and system loads help IT to recognize when additional resources are required. In this way, performance losses due to resource bottlenecks are avoided. This ensures that the IT Infrastructure will continue to the company’s growth in the future.

Security and compliance: In times of rapidly growing threats from cyberattacks, professional IT infrastructure monitoring plays a key role in detecting and fending off these attacks and threats as early as possible. Monitoring network protocols, network traffic and system behaviour uncovers potential security breaches, anomalous activities or unauthorized access attempts. This enables IT to take immediate countermeasures, mitigate risks and compliance and data protection regulations are adhered to.

The most important requirements for modern IT Infrastructure Monitoring

This raises the question of what requirements modern IT Infrastructure Monitoring must fulfill in order to monitor even complex IT environments.

Comprehensive coverage of systems, technologies and platforms: The monitoring solution should cover a broad spectrum of IT Infrastructure components: servers, networks, storage systems, virtualization platforms, databases, applications, cloud services, etc. – the more heterogeneous and hybrid (combination of on-premise operation and cloud use) the IT environment, the more important it is that the monitoring solution supports as many operating systems and technology platforms (e.g. the large hyperscaler cloud platforms) as possible.

Real-time monitoring and alerts: The monitoring solution should offer real-time monitoring and alert functions in order to record and analyze KPIs as quickly as possible, but also continuously. If predefined threshold values are exceeded or anomalies are detected, the right IT department must be notified immediately so that it can respond promptly and minimize the threat of downtime.

Centralized management and visualization: A centralized management console is particularly important for monitoring large and distributed IT environments. The solution must be able to provide a consolidated view of the entire IT Infrastructure at the touch of a button. IT can use it to access real-time and historical monitoring data, configure monitoring settings and manage alerts. Intuitive visualization and reporting functions are also important to facilitate data analysis and decision-making.

Scalability and flexibility: As modern IT environments generally grow and develop continuously, the monitoring solution should have a high degree of scalability in order to be able to process growing data volumes and new infrastructure components. The solution should also be flexible enough to adapt to changing business requirements and take future technological developments into account.

Integration and APIs: Integration capabilities are essential for seamless integration with other IT management tools and systems such as IT ticketing systems, service desk platforms or IT operations management frameworks. The monitoring solution should provide APIs and support common protocols to enable data exchange and integration with third-party tools, making it easier to automate and optimize workflows.

Automation and intelligent analytics: Artificial intelligence is also playing an increasingly important in IT infrastructure monitoring. Advanced monitoring solutions use automation and intelligent analysis functions such as machine learning and other AI technologies to recognize patterns, detect anomalies and predict potential problems. These functions support IT in proactively addressing problems, automating routine tasks and thus optimizing the performance of the overall system.

Nagios and Icinga: Open source tools for IT Infrastructure Monitoring

As in other areas of software use, open source solutions such as Nagios or Icinga have become firmly established in IT Infrastructure Monitoring. The following arguments for using an open source IT infrastructure monitoring solution are generally cited.

Costs: Open source tools are usually offered free of charge. Instead of spending money on the purchase of commercial solutions, companies can use this budget for other important areas.

Adaptability: Open source tools offer the freedom to adapt the  monitoring solution to company-specific requirements. The source code of the solution can even be modified for this purpose. This flexibility is generally not available with commercial solutions.

Vendor independence: By using open source tools, companies are not tied to a specific provider or technology stack. They have the freedom to choose and switch between different tools and platforms without being tied into proprietary ecosystems. Vendor lock-in is therefore ruled out from the outset.

Community support: Open source tools usually have an active community of developers and users who contribute to their optimization and further development and provide support. Individual users benefit from a wealth of knowledge, forums, documentation and updates and add-ons provided by the community.

Nagios: the most important functions

Nagios is a popular open source tool for IT Infrastructure Monitoring. The solution enables the monitoring of a wide range of infrastructure components such as servers, switches, routers, applications, services and network protocols. Nagios supports both active and passive controls collecting real-time monitoring data.

In order to be notified in time, the Nagios user can define thresholds and conditions at which an alarm is triggered. Notifications can be sent via a variety of channels such as email, SMS or user-defined scripts to ensure that the right person is informed immediately when incidents occur. In addition, the system includes an event handling mechanism that automatically executes predefined actions or scripts when a problem occurs. An escalation function ensures that critical notifications are escalated to an appropriate location if the original notification has not been responded to.

Nagios has a central web-based user interface that provides a complete overview of the entire monitoring environment. Users can also make the relevant monitoring settings, retrieve status information, confirm alerts and perform other administrative tasks. Integration into various external tools and applications such as IT ticketing systems, IT service management (ITSM ) and reporting tools is also possible.

Nagios has a very large and active community of users and developers who contribute to the continuous development and support of the tool. This community-driven ecosystem ensures that Nagios stays up to date with new features, bug fixes and the availability of plugins.

Icinga

Another open source tool for IT Infrastructure Monitoring is Icinga. Icinga was originally developed as a fork of Nagios. The aim of the developers was to rectify shortcomings in the development process of Nagios and to eliminate existing limitations of Nagios. This applies in particular to the web interface Icinga Web2 as well as additional database connectors and a REST API. The first stable version 1.0 of Icinga was released in December 2009.

Due to its direct “descent” from Nagios, Icinga has similar basic functions when it to monitoring different IT Infrastructure components, alarm functions and corresponding monitoring settings. However, there are also some differences.

Nagios vs. Icinga: a comparison

As already mentioned, one focus of the development of Icinga was the further development of the web-based user interface. The Icinga web interface Icinga Web2 is rated by users as more modern and user:friendly compared to Nagios. Icinga Web2 is particularly known for its appealing design and user-friendliness and offers an intuitive user experience when monitoring and managing the infrastructure.

Special attention was paid to the graphical representation when developing the Icinga user interface. Icinga provides built-in support for graphical dashboards and visualization capabilities that provide users with customizable views and charts to monitor the status and performance of their infrastructure. To create graphical dashboards in Nagios, additional plugins or external tools may be required.

There are also differences between Nagios and Icinga when it comes to configuration: Nagios traditionally uses a “flat file” configuration format, which can be very complex and time-consuming to use, especially in larger IT environments. Icinga, on the other hand, has an improved configuration format that is clearer and more modular. In addition, Icinga follows a template-based configuration approach. It is easier to
define reusable configuration templates for hosts and services. This simplifies configuration management and improves scalability.

Compared to Icinga (2009), however, Nagios has been on the market for ten years. The first version was presented on March 14, 1999. This inevitably has an on the size of the ecosystem and the community, the documentation and additional resources.

Nagios has a much larger range of additional plugins, but Icinga is fully compatible with all Nagios plugins. Icinga users can therefore the existing Nagios plugin library.

IT Infrastructure Monitoring with open source tools – the most important criteria

If a company is considering using an open source tool for IT Infrastructure Monitoring, the first step should be to check the organizational requirements for the use of such a tool.

Organizational requirements for the use of open source monitoring tools

This starts with the technical expertise within the company itself. The use of open source tools for IT Infrastructure Monitoring generally requires corresponding open source expertise within the company. In the case of commercial software, the software provider usually offers appropriate support – either directly or via specialized implementation partners. With open source software, there is only the publicly available documentation and the community. This means that there must be experts in the company itself who have the necessary knowledge and skills to use, configure, adapt and maintain the monitoring solution effectively. This is the only way to ensure that the tool implemented properly and that its potential is fully exploited.

Especially with regard to the documentation available for a specific open source tool, it is important to clarify in advance how extensive it is. It must be ensured that the documentation is comprehensive, up-to-date and easily accessible for IT. In addition, companies should consider training their employees so that they can use and manage the chosen tool efficiently.

The same applies to the community: open source tools thrive on the support and contributions of the community. Companies should check how large and active the community surrounding the chosen tool is. An active community ensures continuous development, bug fixes and access to a wealth of knowledge, forums and resources for support and assistance.

Another important prerequisite for the successful use of an open source tool for IT Infrastructure Monitoring is the question of integration into existing systems. It is important to ensure that the tool can be seamlessly integrated into other IT Infrastructure components such as IT ticketing systems, configuration management systems or reporting platforms.

Finally, the scalability and performance the open source monitoring tool should also be clarified. Is the tool able to grow with the growing requirements of the IT Infrastructure? How does this growth affect performance and the ability to process ever larger volumes of monitoring data? Is the tool capable of monitoring geographically distributed IT environments? All of these questions should be clarified in advance before the selection of an appropriate tool is considered.

Total cost consideration: open source is (not) always the cheaper option

An important aspect when considering whether to use an open source tool is, of course, the cost. At first glance, open source software performs better than commercially distributed software because it is usually offered free of charge . The price difference can be considerable , especially for large companies that require many software licenses.

At second glance, however, it is of course not enough to focus solely on the acquisition or license costs. Instead, a total cost analysis is required that also takes the following cost blocks into account.

Customization and integration: Open source software generally offers the flexibility to adapt and modify the software to company-specific needs. In theory, this is an advantage over commercial software, which often has narrower limits in this area. Nevertheless, these adaptations and changes must also be carried out, monitored and, if necessary, revised by someone, which causes additional effort and therefore
additional costs.

Support and maintenance: Commercial software often includes support and maintenance services provided by the provider, which are either included in the license costs or can be used additionally. In contrast, when open source software, you can rely on support from the community. Nevertheless, support and maintenance capacities are also required internally within the company, which associated with corresponding costs.

Upgrades and updates: At first glance, the pendulum also swings in favor of open source solutions when it comes to this cost point. Commercial software providers generally publish regular updates and new versions, which are associated with costs for updating licenses or maintenance contracts. Open source software, on the other hand, offers updates and upgrades at no direct cost. The flip side of the coin is that the companies using these open source solutions have to invest time and resources – and therefore money – in managing updates and ensuring compatibility with other components of the IT Infrastructure.

Conclusion: As is so often the case in life, the cost comparison between commercial software and open source solutions always depends on the individual case. At this point, it is important to note that a pure comparison of the acquisition costs is not sufficient, but that a total cost comparison must always be drawn up. Only then will it become clear whether open source software really is the cheaper alternative.


Example 2: Extension of the Icinga connection to CA SOI for dynamic alarm titles

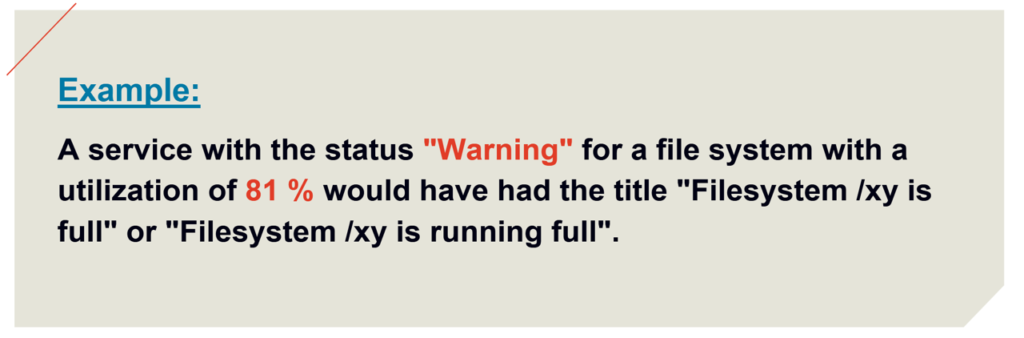
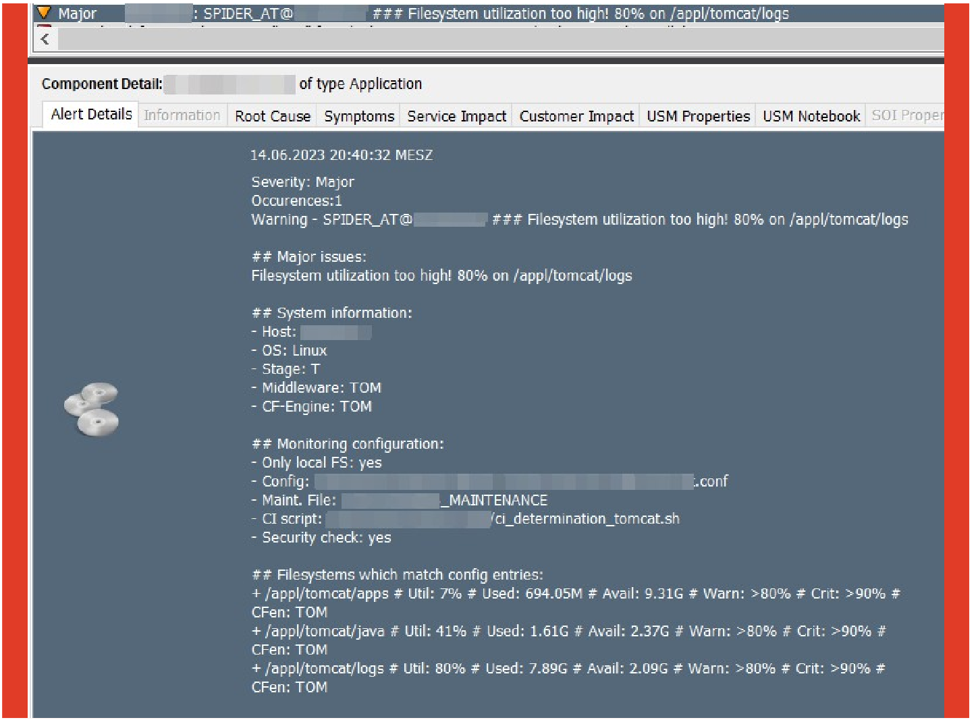
Originally, alarm messages from Icinga to CA SOI could only contain a fixed string as the alarm title or alarm summary, which is then used as the incident title. This title was fixed – regardless of the priority of the alarm – and therefore sometimes proved to be not meaningful enough.

Icinga Nagios Automotive Example 2

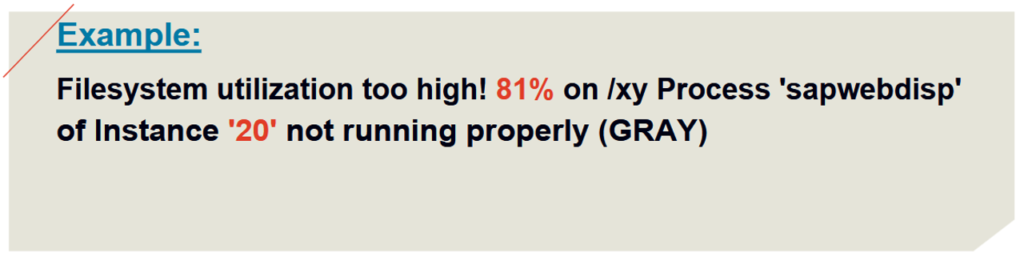
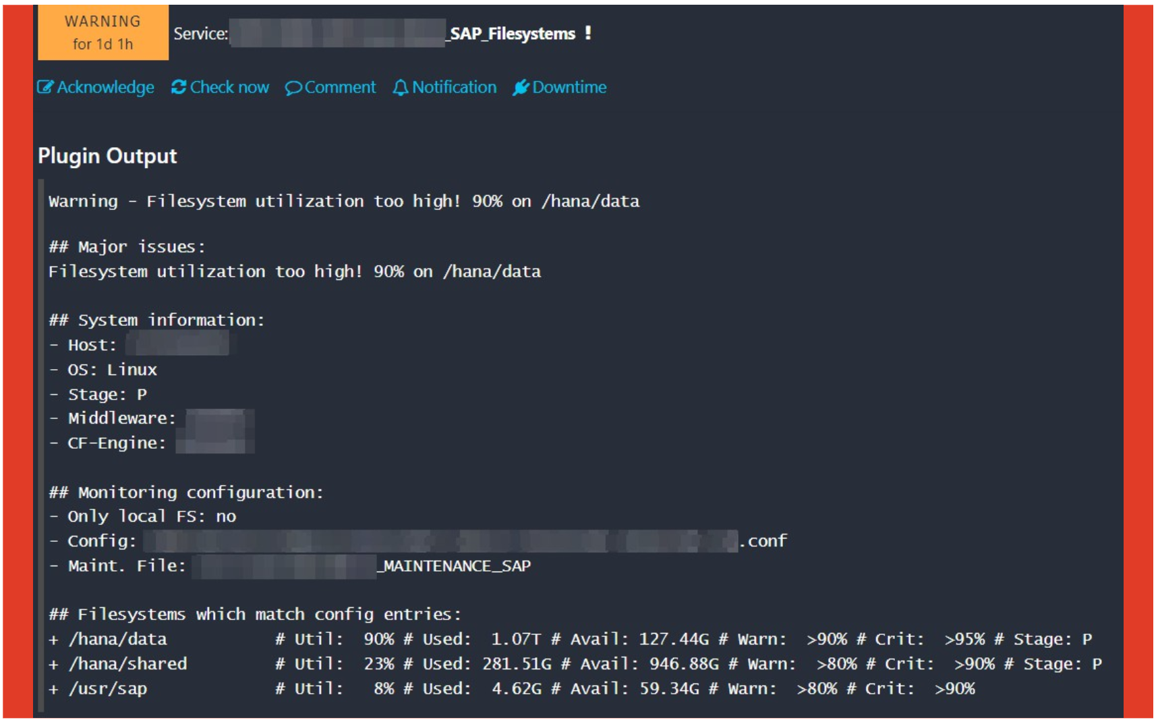
amasol recognized the potential for optimization if the actual measured values are also transferred to the alarm title by using the output of the Icinga plugins . However, this is not possible for every Icinga service, as the output of some plugins does not meet the requirements of an alarm title. However, the plugins developed by amasol are all designed to provide a detailed and useful output that is suitable as an alarm and incident title.

amasol then developed a switch in the Icinga service (and thus individually configurable for each service) for switching the title display. A fixed and predefined alarm title is still sent to CA SOI or the first line of the plugin output.

An advanced notification script uses the first line of the plugin output when the switch is activated and removes the status information (“Warning: “, “WARNING – “, “Critical: “, …). The cleaned “Event Message” is then sent to the alarm console as the alarm title.

With all plugins developed by amasol, it is possible to activate this option and thus – if desired by the customer – always transmit helpful and precise alarm titles.

Icinga Nagios Automotive Example 3

Dashboard_Filesystem utilization warning
Filesystem utilization warning

Example 3: Extension of the connection from Icinga to CA SOI for variable CIs

Originally, alarm messages were sent to SOI with fixed CIs configured in the Icinga service. However, this construct is too rigid for various applications. For example, for basic monitoring of web servers, each web server on each server has its own CI. A separate Icinga service would therefore have to be set up for each web server on each server. Another example is SAP monitoring: Each SAP component has its own CI, but due to the complexity of the SAP environment, it would not be possible to monitor each SAP component on a server individually via a corresponding service – and for each SAP server at that.

The required flexibility is achieved by having the CI determined by the monitoring plugin on the server and sending it as a CI in the notification.

For such special cases, amasol develops Icinga plugins that determine the CI on the respective host and output it in the plugin output in a predefined format.

In addition, the notification script and the Icinga service have been extended by a further switch to additionally read the CI from the plugin output and send it to CA SOI instead of the CI defined in the service.

First line of a plugin

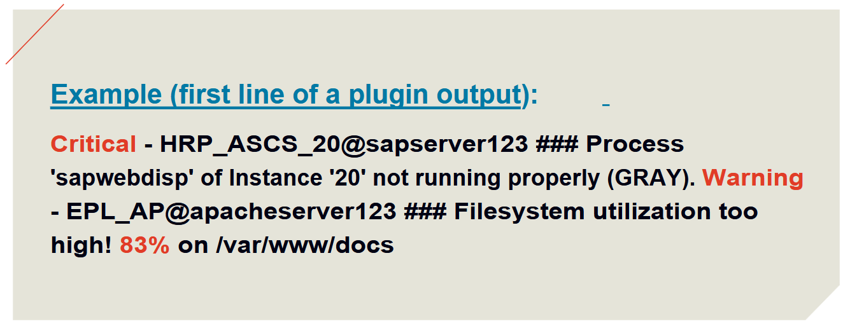
Custom plugins (based on own framework for bash-based plugins)

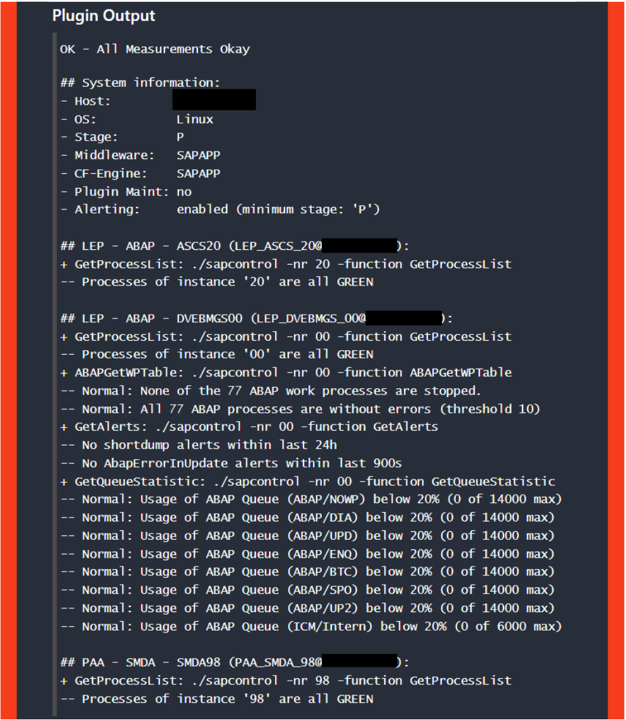
As mentioned at the beginning, amasol has developed a whole series of its own plugins for Icinga that on Linux, AIX, HP-UX and SunOS. The plugin output of all these plugins has been enriched with system/meta information.

All plugins can be set to “maintenance” mode via flag files (still active monitoring, but deactivated alerting/notification). In addition, alarm messages can be deactivated using a switch for low stages (e.g. “Test” stage). This is possible regardless of where the service is running: The plugin takes care of this.

The plugins are “cluster-aware”, i.e. there is no alerting on inactive cluster nodes.
In addition, called programs (e.g. df) are monitored and hanging processes (except for processes started via sudo) are “killed” after a configurable timeout is reached. This ensures that the timeout of the Icinga services does not leave any processes (orphans) on the system and deprives the system of its resources after a certain time. Information is provided about hanging processes that were started via sudo.

Example Dashboard
Example Dashboard

Examples

– SAP plug-in (over 4,000 lines)

– config-based file system monitoring plugin (only file systems that actually exist on the server are processed according to threshold values and filter criteria (such as stage and meta flags) are monitored from the config

– ulimit monitoring (nproc and nofile) for specified users

– Pacemaker cluster monitoring

As the practical example shows, the use of open source tools for IT Infrastructure Monitoring offers advantages in terms of flexibility and openness when it comes to customization and further development.

However, these advantages can only be exploited if the necessary expertise and capacities are available – with the corresponding impact on costs and budget requirements.

Plugin Output Dashboard

Practical example: Use of Icinga for IT Infrastructure Monitoring in the automotive industry

The following practical example illustrates the initial situation and the reasons that led a major international company in the automotive industry to decide to use Icinga as an IT Infrastructure Monitoring tool. It also looks at the effects associated this decision.

Starting point: costs and shadow IT

In 2017, the company decided to replace a commercial software solution previously used for IT infrastructure monitoring with the open source tool Icinga. The corresponding migration project was then launched at the beginning of the following year.

In addition to the strategic decision within the Group to the open source approach more strongly within the company, one of the main reasons for the change was the cost: the declared aim was to significantly reduce license costs in this area and benefit from the different valuation of costs (license costs for commercial software = CAPEX, maintenance and operating costs for open source software = OPEX).

A second key aspect for the decision: shadow IT. This term refers to the use of IT solutions (especially software) outside the official control and responsibility of a company’s IT department. Individual employees, but also entire departments, use IT solutions without being approved by the IT department and integrated into the monitoring process. The IT department is often not even aware of the use of these
solutions.

Open source solutions are virtually predestined for shadow IT, precisely because they are available free of charge and only need to be downloaded and installed.

In the case of the company from the automotive industry, it was at least known that Nagios in particular was a popular tool in shadow IT. The official introduction of Icinga was intended to “recapture ” the shadow IT users distributed throughout the company network and convince them that if they are already using an open source tool for IT Infrastructure Monitoring, this is at least a solution that is coordinated with IT.

Ultimately, the aim was to standardize the tool landscape for IT Infrastructure Management.

Challenges and solutions

However, the further use of Icinga showed that the quality of the monitoring results fell well short of expectations and could only be improved by carrying out numerous optimizations and extensions to the Icinga plugins available in the public repositories. In addition, custom plugins had to be developed. The company was supported in this by the Icinga experts at amasol.

Example 1: Icinga agents on Linux servers
In practice, the problem of Icinga agents “hanging” on Linux servers occurs time and . Identifying and restarting the affected agents used to be quite complex and time-consuming. A script developed by amasol

– identifies the corresponding agents via the CLI Command Console of Icinga2,

– determines the corresponding server name and

– restarts the agents via SSH

All this is done without any user interaction, as the script is automatically started daily via cronjob (the Linux scheduler) and then takes care of the agent restarts. Different network zones are also taken into account and jump servers are used for the SSH connection.

Result: The uptime of the Icinga agents is increased without anyone having to take care of it manually.

Best practices for the use of open source tools for IT Infrastructure Monitoring

The following best practices are intended to provide assistance for the use of open source tools for IT Infrastructure Monitoring.

Evaluation of the current IT Infrastructure

Before even thinking about the choice of tool , an assessment of the company’s current IT infrastructure is a crucial first step:

IT infrastructure inventory: An IT Infrastructure inventory provides an overview of the scope and complexity of the existing IT Infrastructure and provides an answer to the question of which IT Infrastructure components should be integrated into the
monitoring.

Performance and availability requirements: The critical performance and availability requirements for the infrastructure are determined. Factors such as response times, required uptime, throughput and resource utilization thresholds must be considered. This assessment helps to determine the necessary monitoring metrics and thresholds to ensure that the IT Infrastructure meets the company’s requirements.

Current monitoring setup: An assessment of the existing monitoring tools, processes and workflows should then be carried out. This will reveal possible gaps or limitations in the current monitoring setup, such as a lack of visibility of certain components or inadequate alerting functions. This assessment provides information on the areas in which open source monitoring tools can supplement or improve the existing monitoring functions.

Data sources and integration interfaces: The data sources and integration interfaces within the infrastructure that need to be monitored must then be identified. This includes defining the types of logs, performance metrics and events that are important for monitoring. Knowing the data sources helps to assess the compatibility of open source tools and ensure that the required monitoring data can be effectively collected and analyzed.

Scalability and future growth: What requirements are placed on the scalability of the infrastructure? This evaluation helps to assess the scalability of open source tools and ensure that they current and future monitoring requirements.

Defining monitoring objectives and designing an effective monitoring strategy

The next step is to define monitoring objectives and a monitoring strategy. The monitoring objectives serve as the basis for the monitoring strategy. It is important to understand what the monitoring should be about. Possible goals could be

– Ensuring a high availability of the IT Infrastructure

– Recognizing performance bottlenecks

– Monitoring the general system status

– Compliance with regulatory requirements and regulations

– Compliance with service level agreements

– Etc.

Once the monitoring objectives have been defined, the next step is to determine the monitoring strategy. The following topics should be taken into account:

– Determine the critical IT Infrastructure components that must be included in the monitoring

– Defining the KPIs and metrics relevant for IT Infrastructure Monitoring

– Specifying the threshold values and alarms for the defined measured variables

– Creating a monitoring architecture (scalability, network topology, data collection methods, IT security requirements, etc.) and defining the required monitoring tools, agents, sensors, etc.

– Implement a monitoring dashboard for a real-time overview of the performance and status of the IT Infrastructure

– Defining the processes and workflows for handling alert and critical incidents (escalation procedures, roles and responsibilities)

Selection of suitable tool(s), implementation, customization and configuration

Once the monitoring objectives and the monitoring strategy have been defined, the next step is to select the appropriate tool(s). As demonstrated by the examples of Nagios and Icinga, open source tools are particularly concerned with factors such as functionality, scalability, community support and documentation. Compatibility with the IT Infrastructure components and other IT Infrastructure Management systems used in the company must also checked.

The next steps involve planning and implementing the implementation, configuration and customization. It is important to have the necessary capacities and know-how within the company, as – unlike with commercial software – you cannot rely on manufacturer support.

Regular maintenance and updates

Of course, this also applies to maintenance work and updates. With open source monitoring tools, it is important to keep up to date with the latest releases, updates and security patches. However, these must also be installed promptly.

It also makes sense to actively participate in the community for the open source tool: Forums, newsletters and online discussions are important sources of information and offer the opportunity to tips and advice, exchange experiences and contribute to the further development of the tool. This commitment ultimately benefits the entire community.

Conclusion and recommendations

Open source tools for IT Infrastructure Monitoring such as Nagios and Icinga have now firmly established themselves as an alternative to commercial software solutions. However, our experience in practical use has revealed two key limitations:

Summarization and consolidation of incidents

When using open source tools for IT Infrastructure Monitoring, the aggregation and consolidation of incidents can play a limiting role. There are various reasons for this:

Data sources and formats: Open source tools can collect data from a variety of sources that are available in different formats. Integrating and consolidating these data sources can be a challenge, especially if they are not standardized. The result is a fragmented view of incidents and a lack of aggregation as a basis for a complete overview of the IT Infrastructure.

Complexity of the environment: In large IT infrastructures, there can be many different components and systems that need to be monitored. Each of these components can potentially generate incidents. Recognizing correlations between different incidents and merging similar incidents can be difficult, especially if the open source tools do not have integrated mechanisms for intelligent data correlation.

Lack of intelligence and automation: Some open source tools may not provide the automation and intelligence capabilities required to effectively summarize and consolidate incidents. AIOps platforms based on proprietary solutions, on the other hand, can use advanced analytics and correlation algorithms to group incidents, prioritize them and take automatic recovery actions.

Lack of user experience monitoring

The lack of user experience monitoring can also play a limiting role in the use of open source tools for IT infrastructure monitoring. User experience monitoring refers to monitoring the performance and responsiveness of an application from the perspective of the end user. It enables the collection of metrics such as load times, response times, availability and error messages to the quality of the user experience.

Open source tools often focus on monitoring infrastructure components such as servers, networks and databases. These tools may not provide a direct way to capture the actual user experience. Without this perspective, however, it becomes difficult to understand and resolve the impact of infrastructure issues on the user experience. In addition to infrastructure monitoring, it makes to set up supplementary user experience monitoring, ideally in the combination of synthetic user experience monitoring (simulation of user transactions) and real user experience monitoring (observation of “real” user transactions for performance evaluation). These views can be integrated in a central event console or – with automated root cause analysis – in an AIOps environment system.

Discover more about amasol

amasol miniature world with 2 dies on 4 to represent the 4 Abilities of Operational Excellence, two cows and miniature people

Our expertise

Benefit from over 25 years of deep expertise and high-quality service delivery across our key areas

amasol miniature world with a floppy disk and minaiture people. Including a banner with the amasol logo and a banner with the word blog

Resource center

Search through our library of resources for inspiration on how amasol has helped other customers to power their experience business.

amasol miniature world with miniature people and gears to represent how amasol keeps things moving

Our tools

Explore the tools and partnerships that help us drive success and optimize your IT environment.

amasol miniature world with a robot and miniature people which represent amasol

Why amasol

We aim to increase agility, increase the value proposition and improve the efficiency of IT and thus increase business success.