Full-stack observability with proven AI
Unify metrics, logs, traces, and operations into one connected platform with Grafana Cloud
See how teams gain full visibility across applications, infrastructure, and user experience without switching between tools. With amasol as your partner, Grafana becomes a structured, scalable observability foundation tailored to how your systems actually run.
Grafana Cloud: One view. Infinite clarity.
Grafana Cloud unifies logs, metrics, and traces in a single open platform that gives your teams full visibility across systems, services, and environments. Built on Grafana’s composable observability stack, Grafana Loki (logs), Grafana Tempo (traces), Grafana Mimir (metrics), and Grafana (visualization), it enables developers, SREs, and platform teams to detect issues faster, correlate data effortlessly, and operate with confidence, without vendor lock-in.
With amasol as your partner, you unlock the full potential of this stack. We design and operate your telemetry pipeline, ensuring your data is structured, scalable, and actionable from day one. We help teams implement best practices for data governance, access control, and symstem reliability so Grafana does not become another source of operational risk. From initial architecture to ongoing operations, amasol ensures your setup runs consistently, scales with your environment, and delivery actionable insights without unnecessary complexity.
Key benefits
Full-stack observability
Correlate metrics, logs, and traces in a single unified workflow
Open source
Leverage community-driven innovation and open standards without lock-in
Data democratization
Unify disparate data sources into a single pane of glass without migration
Full-Stack Observability
Understand your systems end-to-end through logs, metrics, and traces in one unified view. Read more
AI ASSISTANT
Use natural language to query data, build dashboards, and accelerate investigations across your observability stack. Read more
Dashboards & Data Visualization
Turn complex telemetry into clear and actionable dashboards for every team. Read more
Incident Response & Management
Coordinate alerts, on-call, and response workflows in one place. Read more
Synthetic Monitoring
Continuously test user journeys and system availability from around the world. Read more
Performance & Load Testing
Validate system behavior under real traffic and peak load conditions before release. Read more
Grafana at its core
Why use Grafana Cloud for full-stack observability?
See clearly. Act faster.
Understand system health in real time by connecting services, infrastructure, and databases into a unified view. Teams can spot dependencies early, detect issues faster, and resolve incidents before they impact users.
Investigate smarter
Move from reactive troubleshooting to guided investigation with AI that highlights patterns, explains anomalies, and helps uncover root causes faster. Use live dashboards to validate changes and improve response quality over time.
Scale visibility, control costs
Focus on the signals that matter with Adaptive Telemetry, which reduces noise and prioritizes critical data across your observability pipeline. Optimize cost efficiency across metrics, logs, and traces while scaling from small teams to enterprise environments.
Full-stack observability | from fragmented signals to connected insight
Full-stack observability is the ability to understand the complete state of your systems by correlating metrics, logs, and traces across applications, infrastructure, and user interactions. Grafana Cloud delivers this through an open, standards-based approach built around OpenTelemetry, enabling organizations to unify telemetry without vendor lock-in or reliance on proprietary systems. This open and composable approach allows teams to collect, store, and visualize data across any environment while maintaining control over their architecture. As systems become more distributed and complex, it provides a scalable foundation for observability without creating data silos or limiting future flexibility.
Kubernetes Monitoring with Grafana Cloud | Instant visibility, AI-powered insights, and guided fixes across your clusters
Grafana Cloud brings metrics, logs, and traces from Kubernetes environments into a single view, helping teams understand system health across clusters, services, and workloads. It reduces complexity in dynamic containerized environments and helps teams detect and resolve issues faster while keeping performance and cost under control. At amasol, we design and implement Kubernetes observability setups that work at scale, ensuring your telemetry is structured, reliable, and aligned with how your clusters actually run.
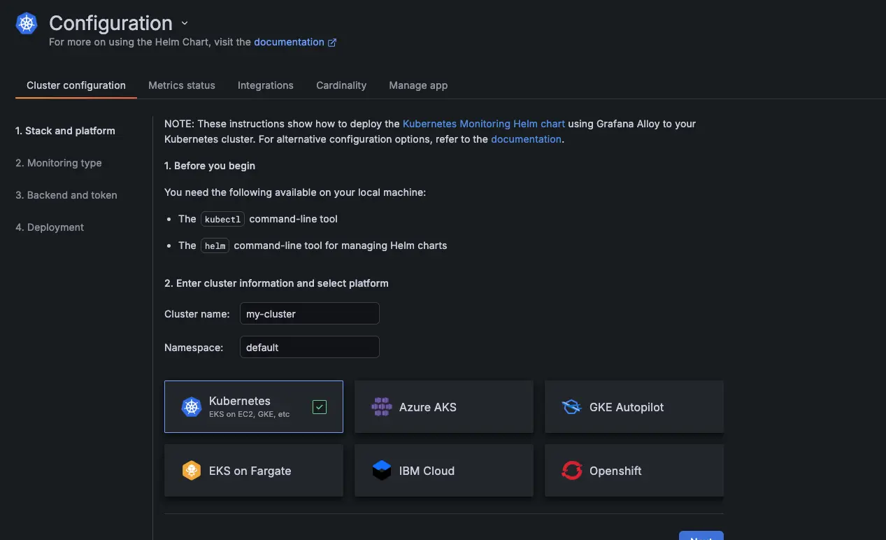
Instant insights, faster time to value
Deploy Grafana Cloud using Helm-based installation and out-of-the-box alerting to gain immediate visibility into Kubernetes health. Built-in dashboards surface key signals like CPU throttling, memory pressure, workload saturation, and cluster-level alert conditions. Correlated metrics and logs reduce time spent switching between signals during incident detection.
AI-powered Kubernetes analysis
AI-assisted investigation helps correlate alerts with underlying cluster behavior, highlighting likely impact areas and guiding next steps during incidents. This reduces manual log correlation and speeds up understanding of service degradation across distributed workloads.
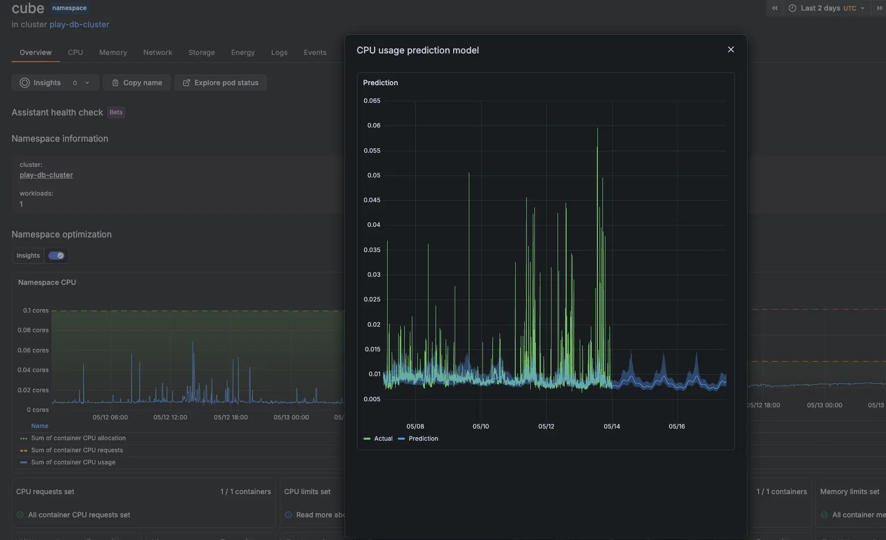
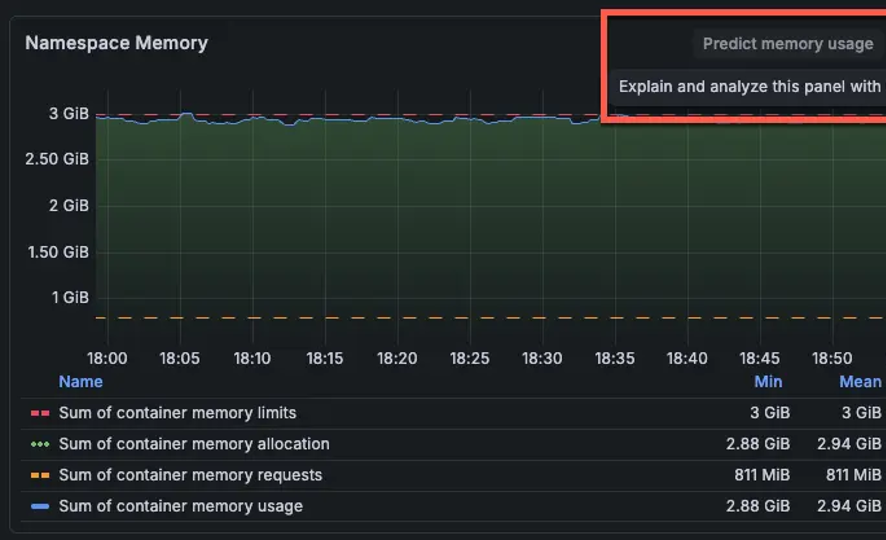
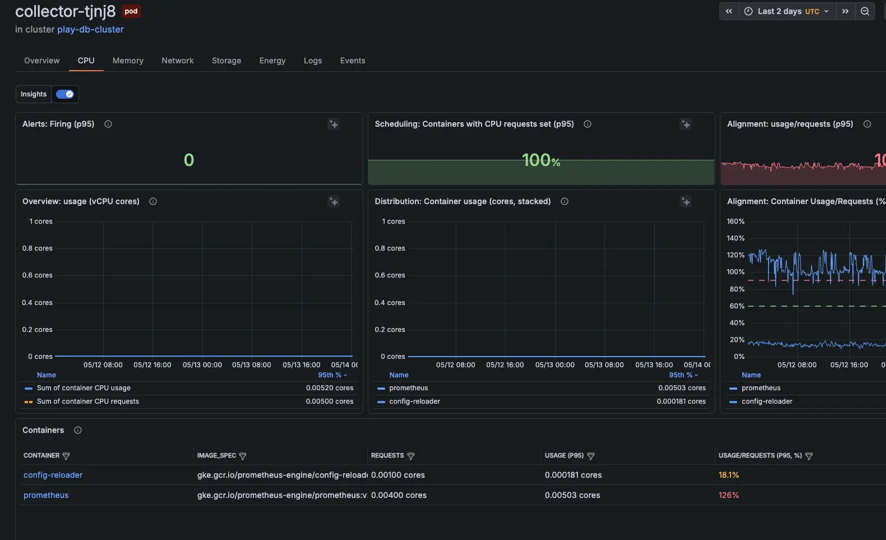
Optimize, analyze, and anticipate resource usage
Analyze CPU, memory, and network utilization against requests and limits to identify inefficiencies and over-provisioning. Time-series analysis of workload behavior enables better capacity planning and cost control across multi-cluster environments, including bursty and autoscaling workloads.
360 visibility, from clusters to containers
Navigate from cluster-level health down to nodes, pods, and individual workloads with full context preservation. Compare historical and real-time performance to identify anomalies, track deployment impact, and debug issues across Kubernetes primitives, including CronJobs and ephemeral workloads.
Application observability with Grafana Cloud | End-to-end visibility, faster root-cause analysis, and unified service insight
Grafana Cloud brings metrics, logs, traces, and profiles together so teams can understand application health in one place. It helps reduce the time to detect, investigate, and resolve issues across distributed systems. Built on open standards like Prometheus, it stays flexible and avoids vendor lock-in as applications scale. Our consultants design and operate observability setups that make application behavior easier to interpret, reduce noise, and ensure teams focus on the signals that matter most.
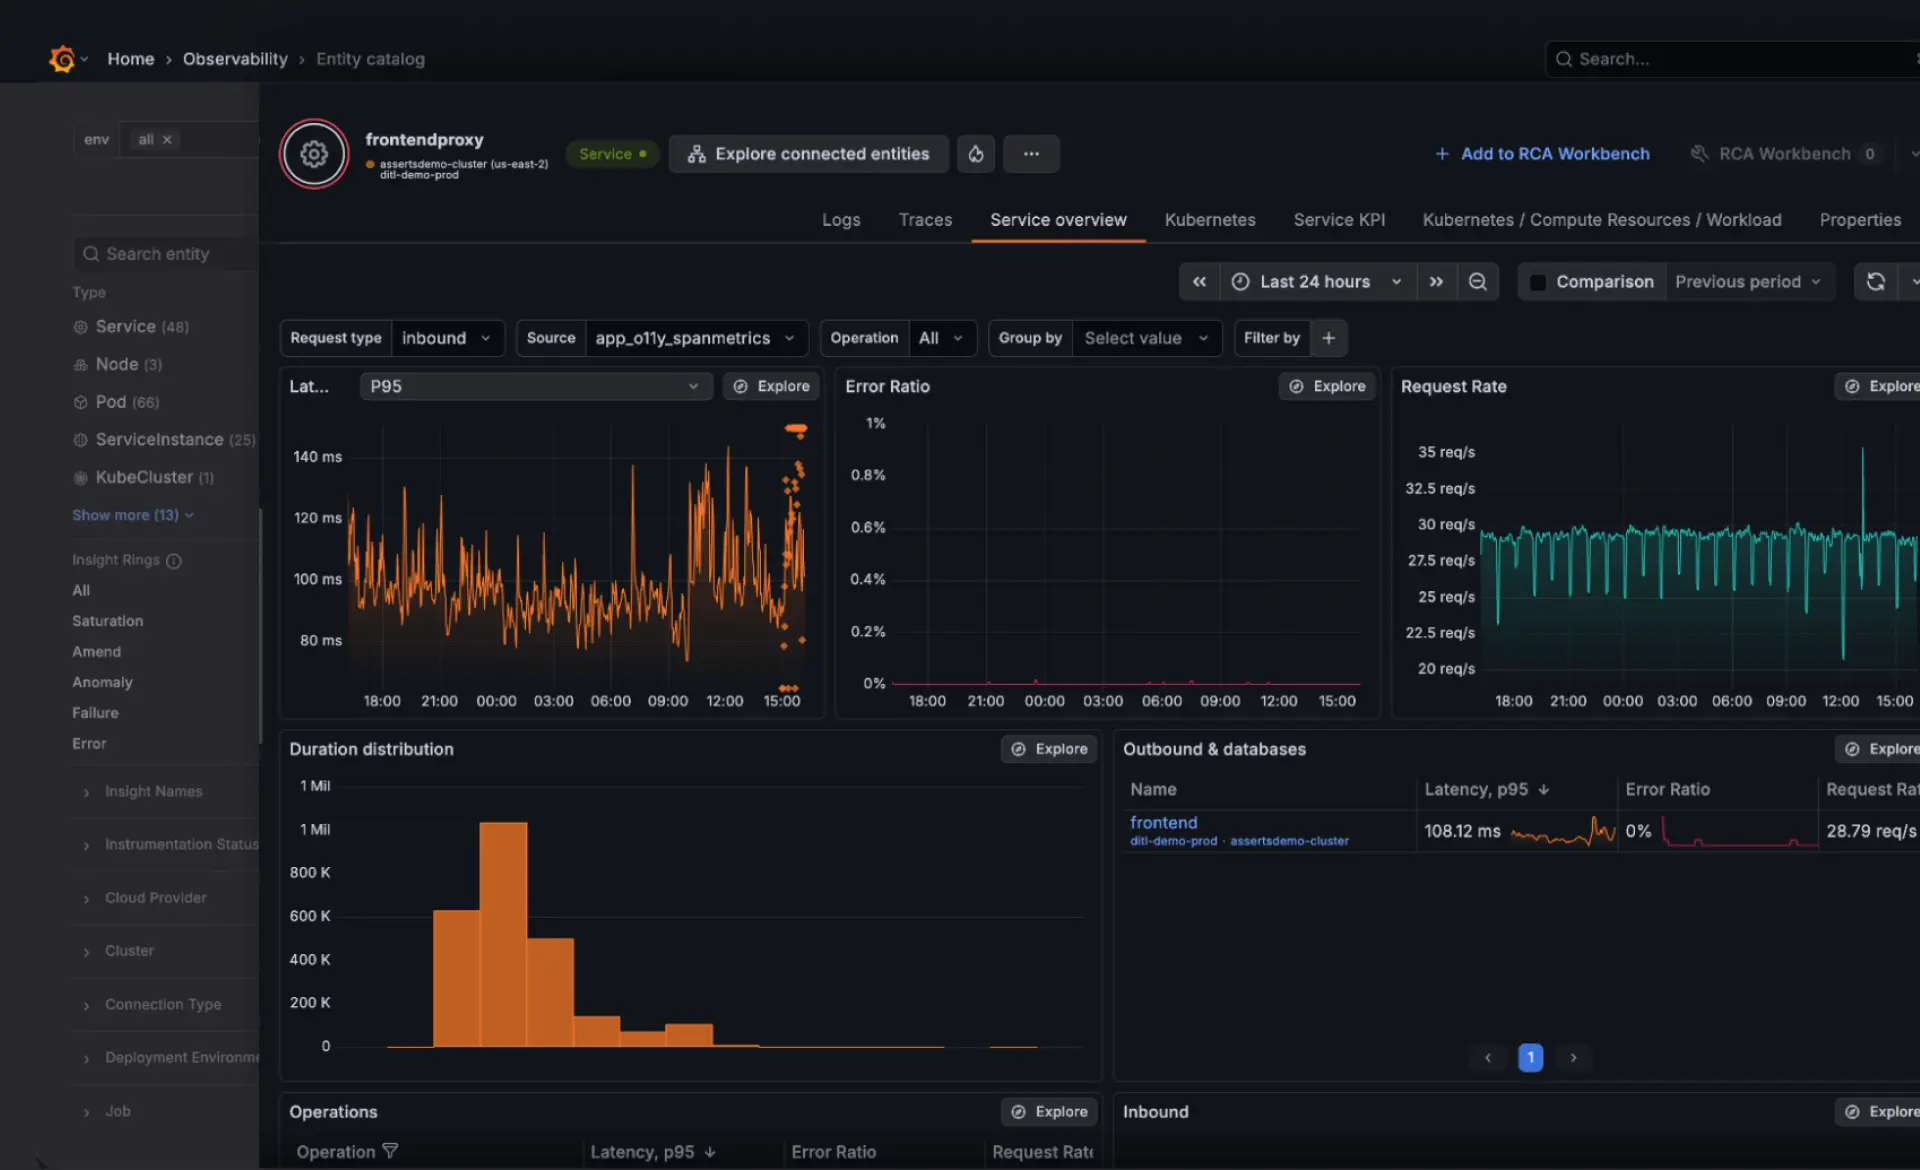
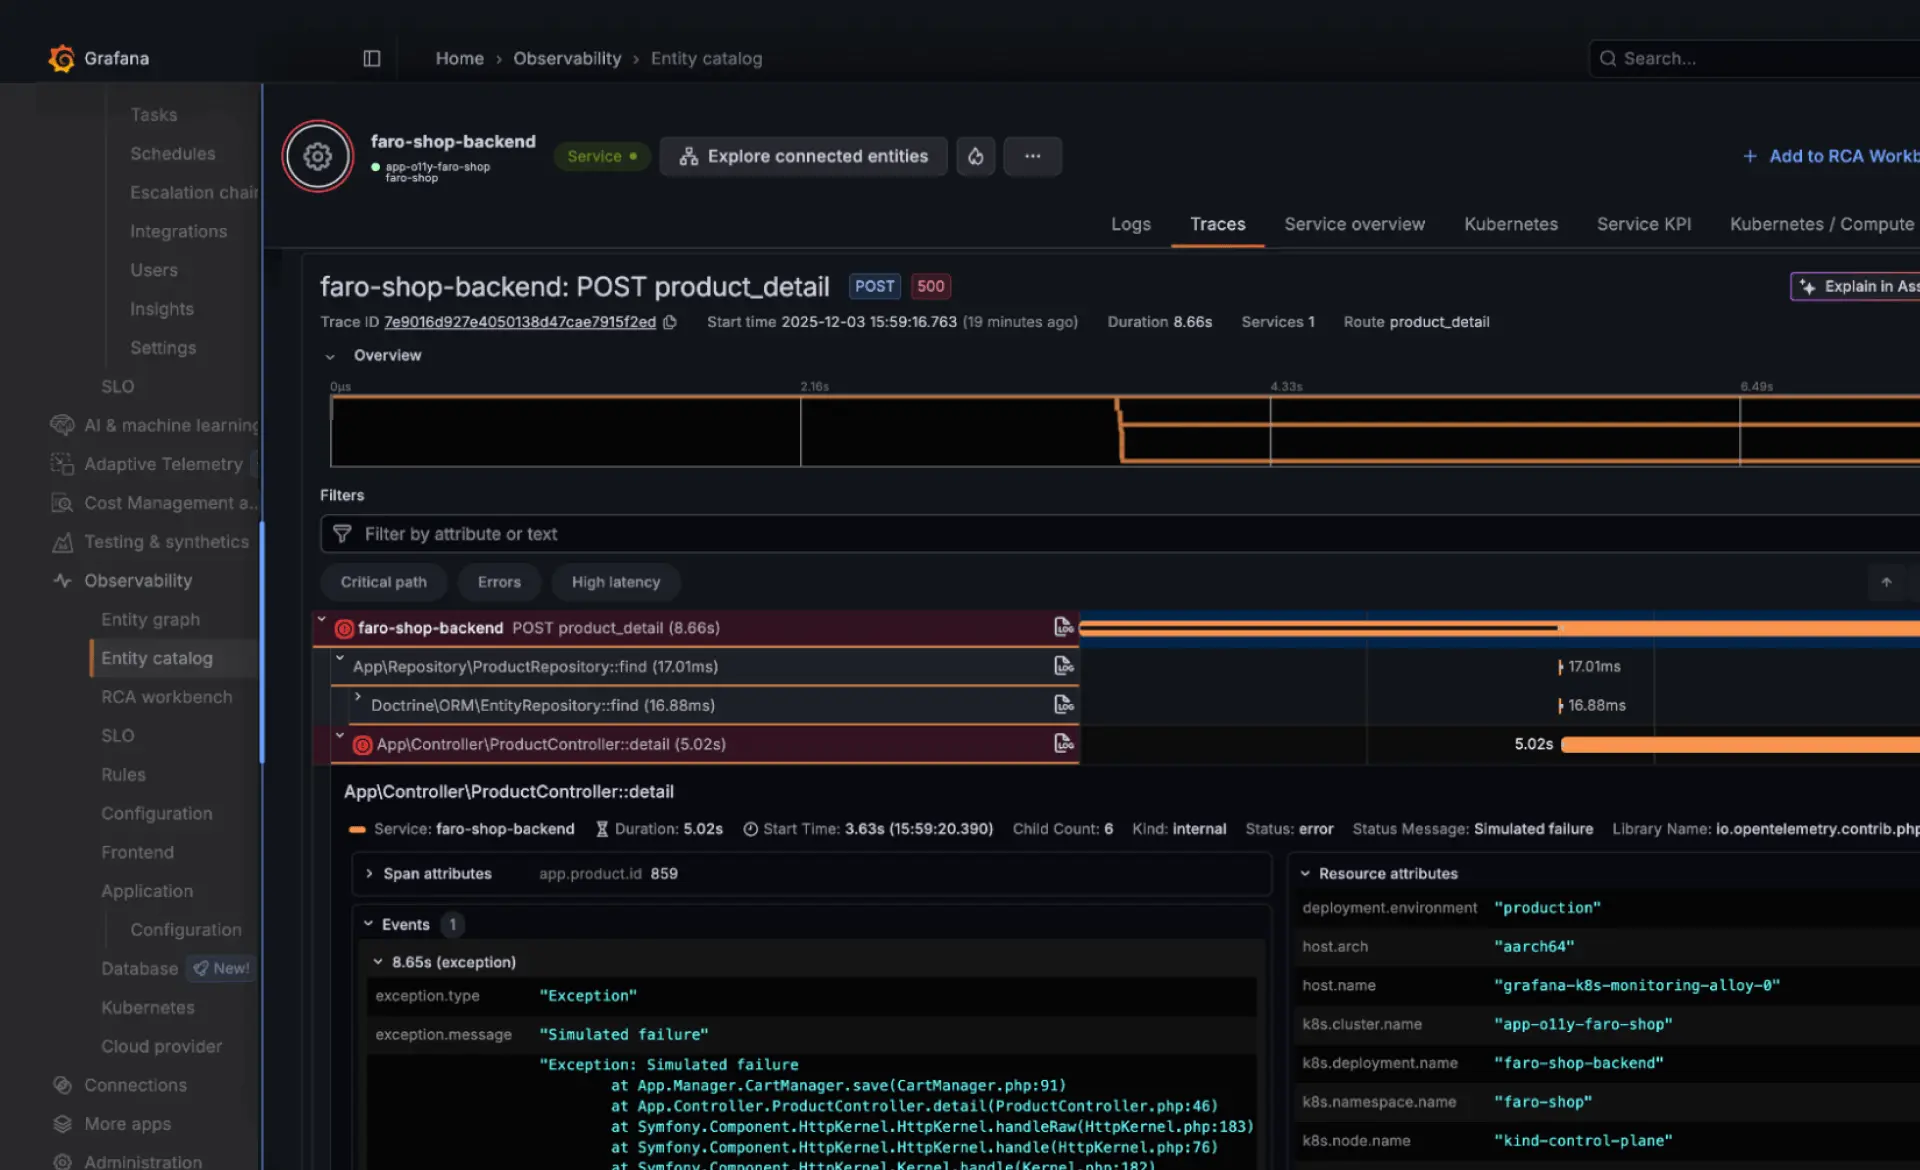
End-to-end observability
View services in real time through a service inventory that shows health, performance, and dependencies across your system. Service maps and RED metrics help teams quickly identify failing services and their upstream impact. Automatic baselining highlights deviations in performance so issues are detected early in complex environments.
Correlate signals across the full stack
Grafana Cloud brings metrics, logs, traces, and profiles together using the OpenTelemetry data model. It connects application and infrastructure data, allowing teams to move from metrics to logs and traces in a single workflow for faster investigation.
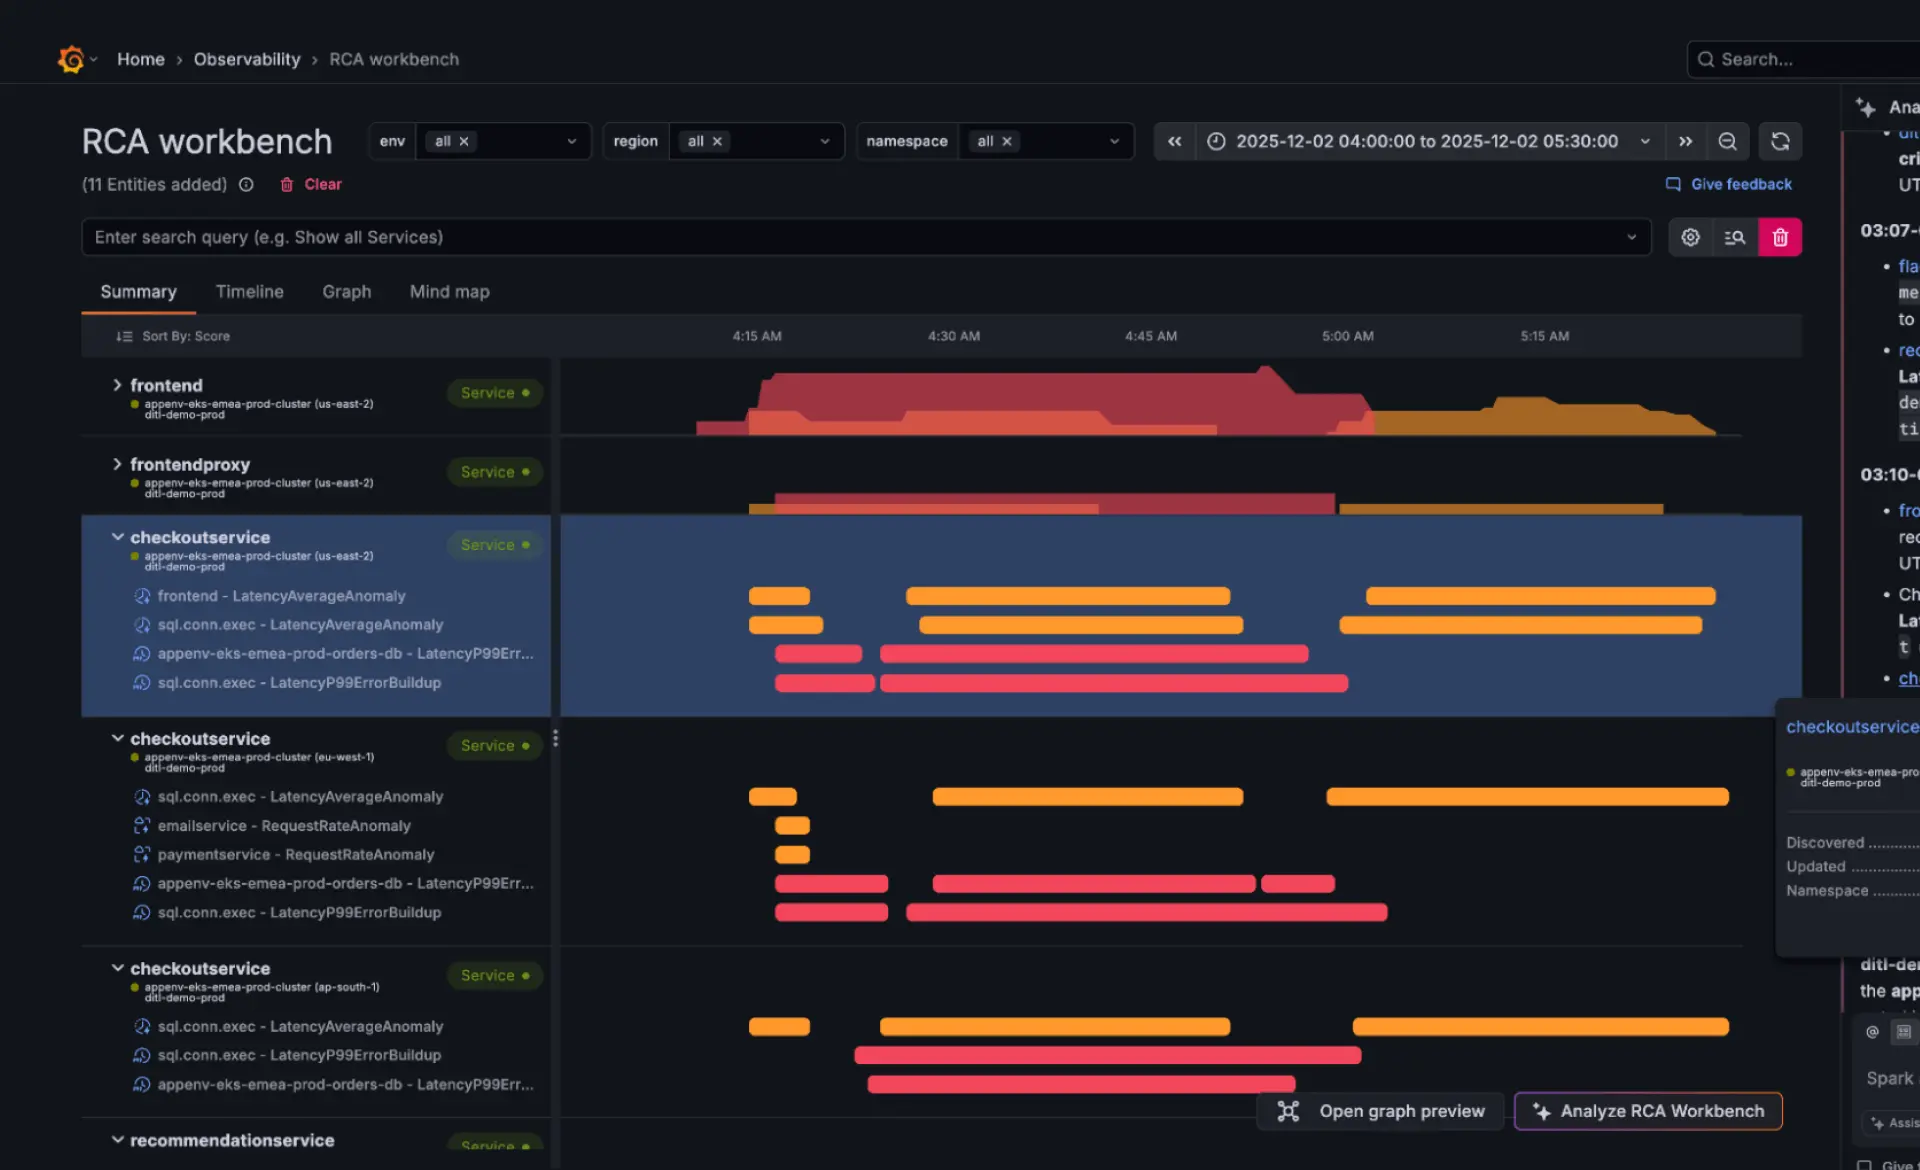
Find root causes faster with the knowledge graph
The Knowledge Graph connects signals across services, dependencies, and timelines to surface likely causes of incidents. By linking errors, saturation, and performance changes in one context, it helps teams reduce time to resolution and understand how issues propagate across the system.
Compatible with OpenTelemetry and Prometheus
Grafana Cloud integrates natively with OpenTelemetry and Prometheus, allowing teams to instrument once and avoid vendor lock-in. With tools like Grafana Alloy, telemetry pipelines can collect and route data across both metrics and traces in a consistent way.
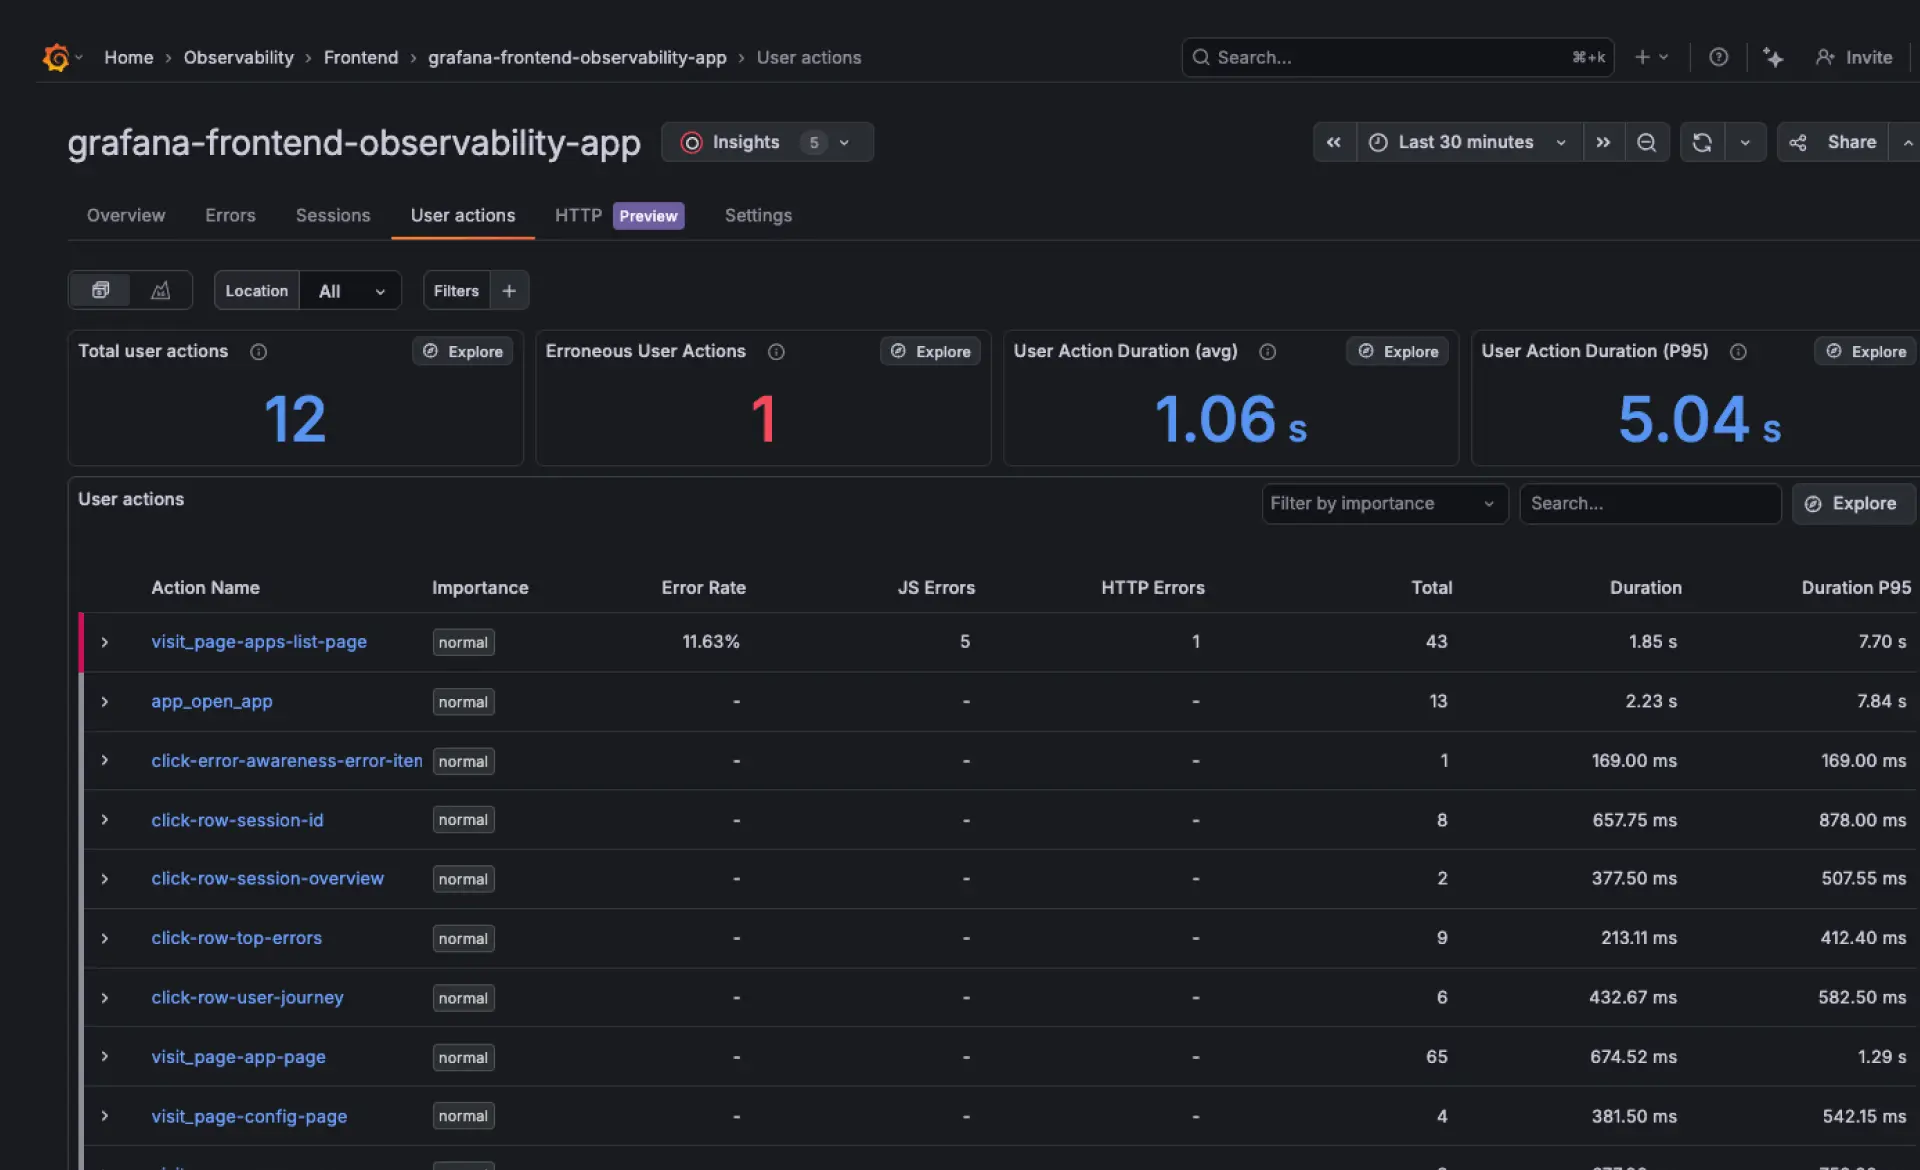
Frontend observability with real user monitoring (RUM) | detect issues before users report them
Grafana Cloud connects frontend behavior with backend performance so teams can understand how user interactions are affected by system changes. This helps detect regressions early, measure the impact of releases, and resolve issues before they affect end users. amasol helps you implement real user monitoring correctly by ensuring your data is clean, consistent, and structured for meaningful analysis, so your teams can focus on improving performance and user experience instead of managing instrumentation complexity.
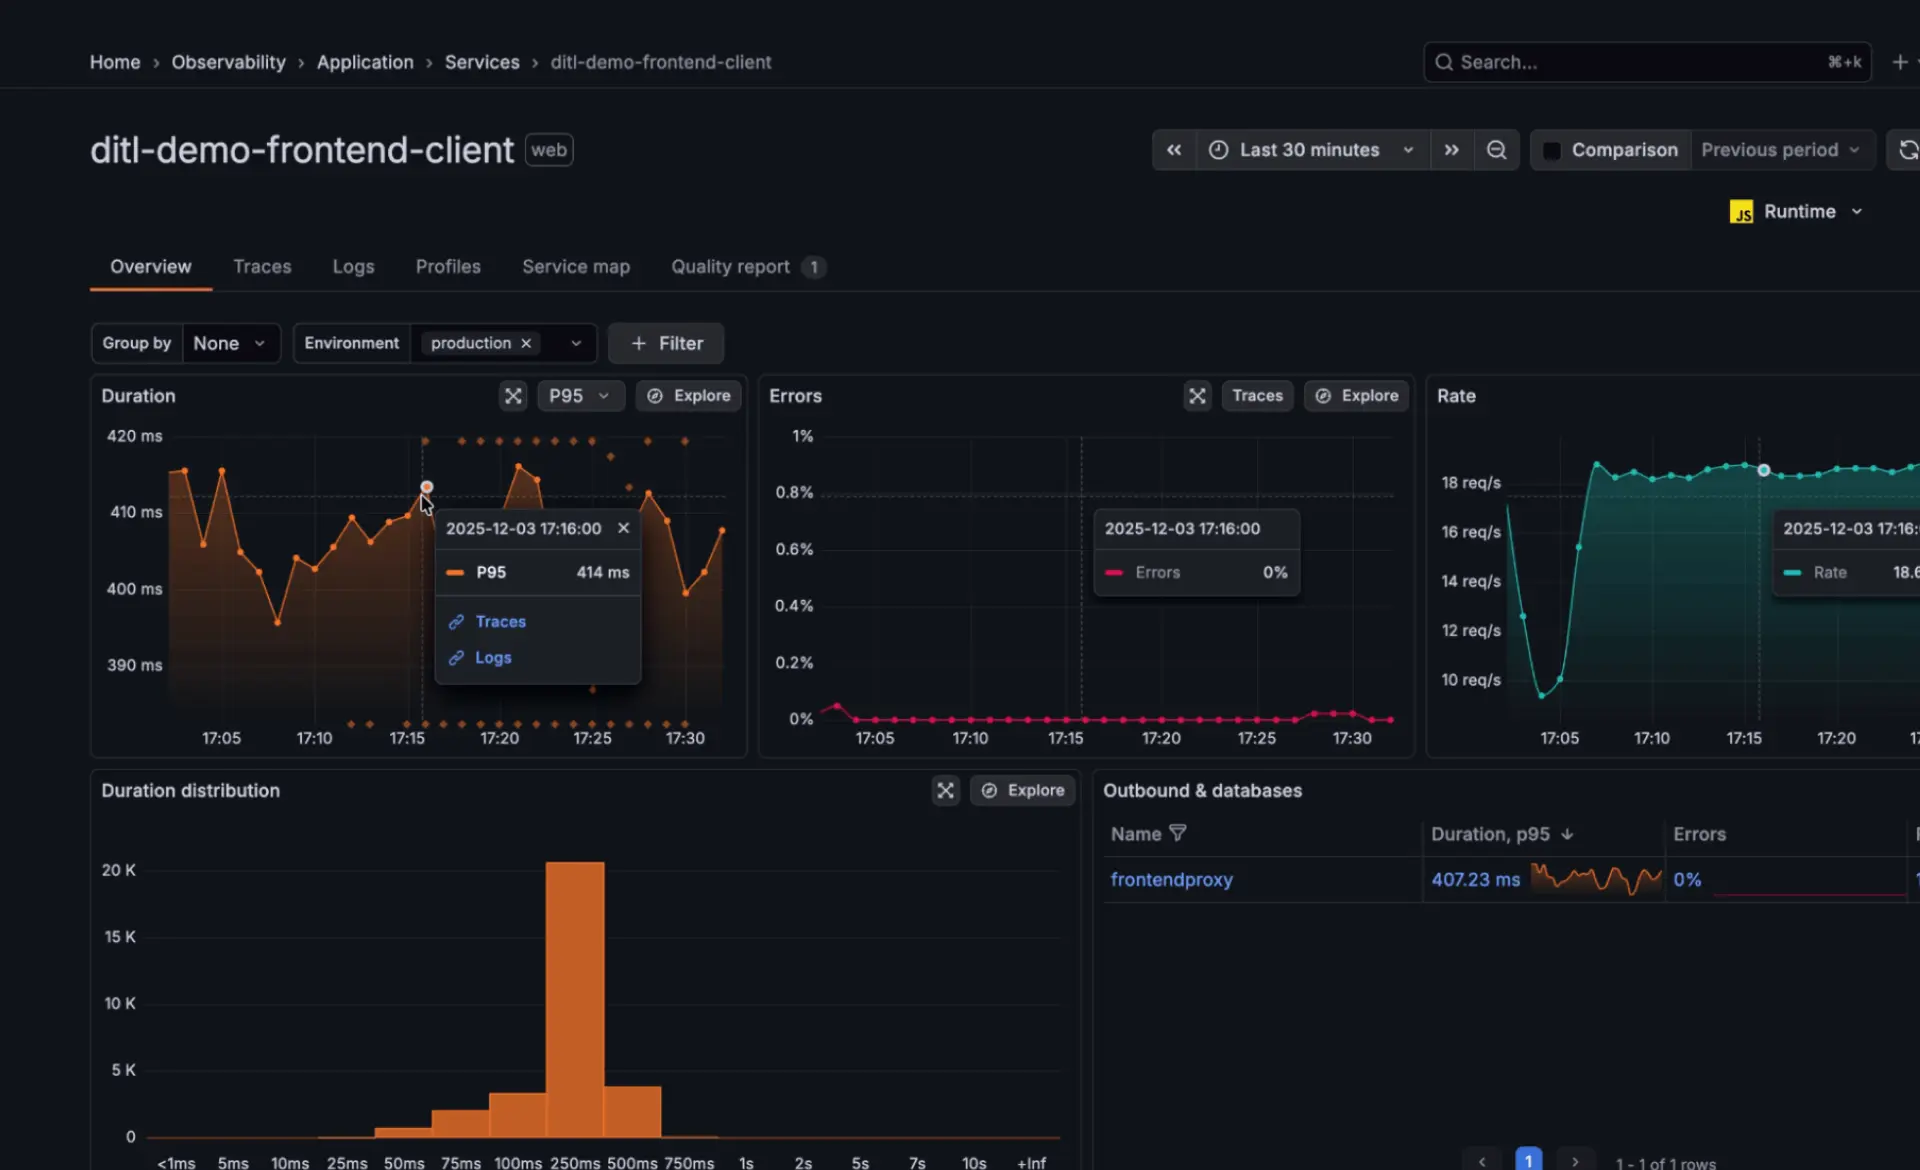
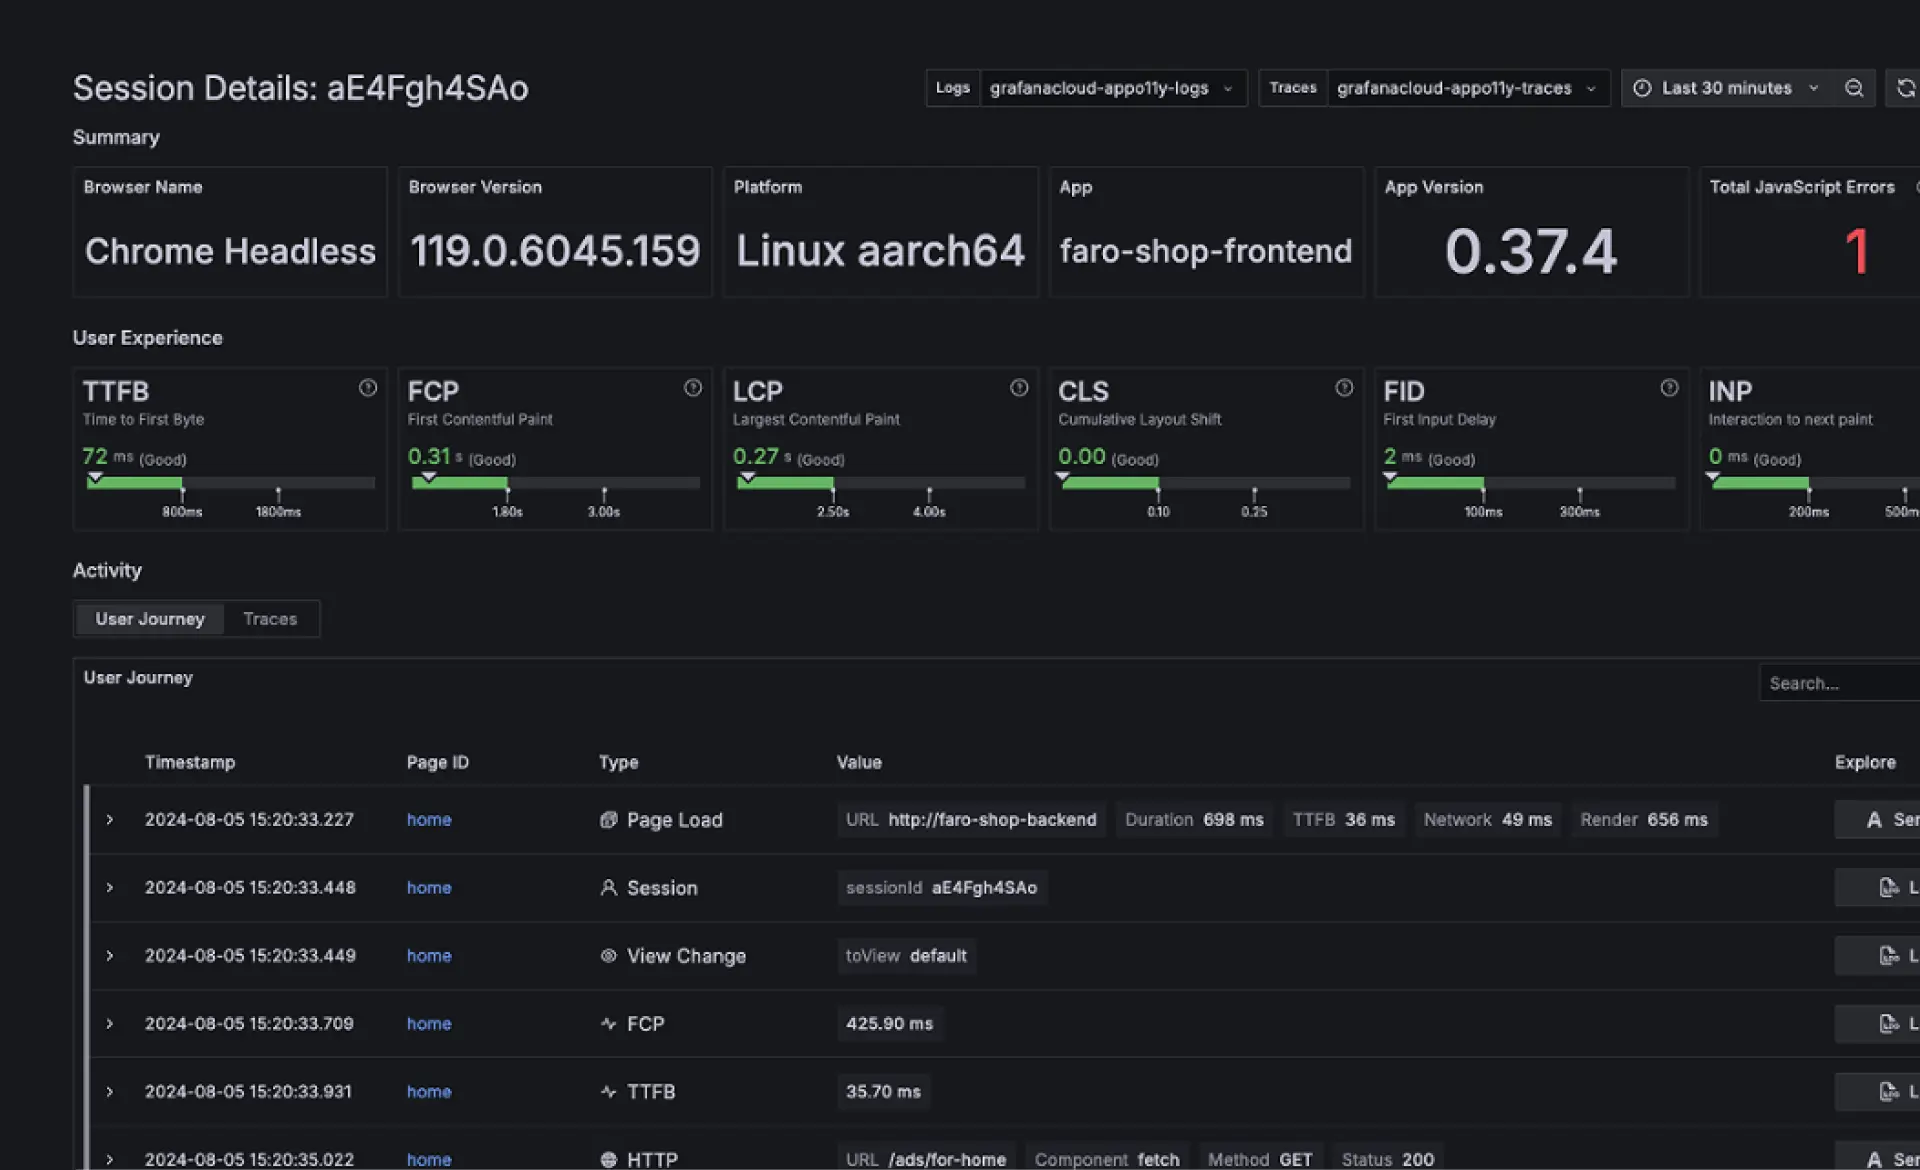
Monitor the end-user experience
Grafana Cloud RUM helps you measure real user performance, including page load times, interactions, and layout shifts. You can break down performance by device, version, or session to understand how different users experience your application.
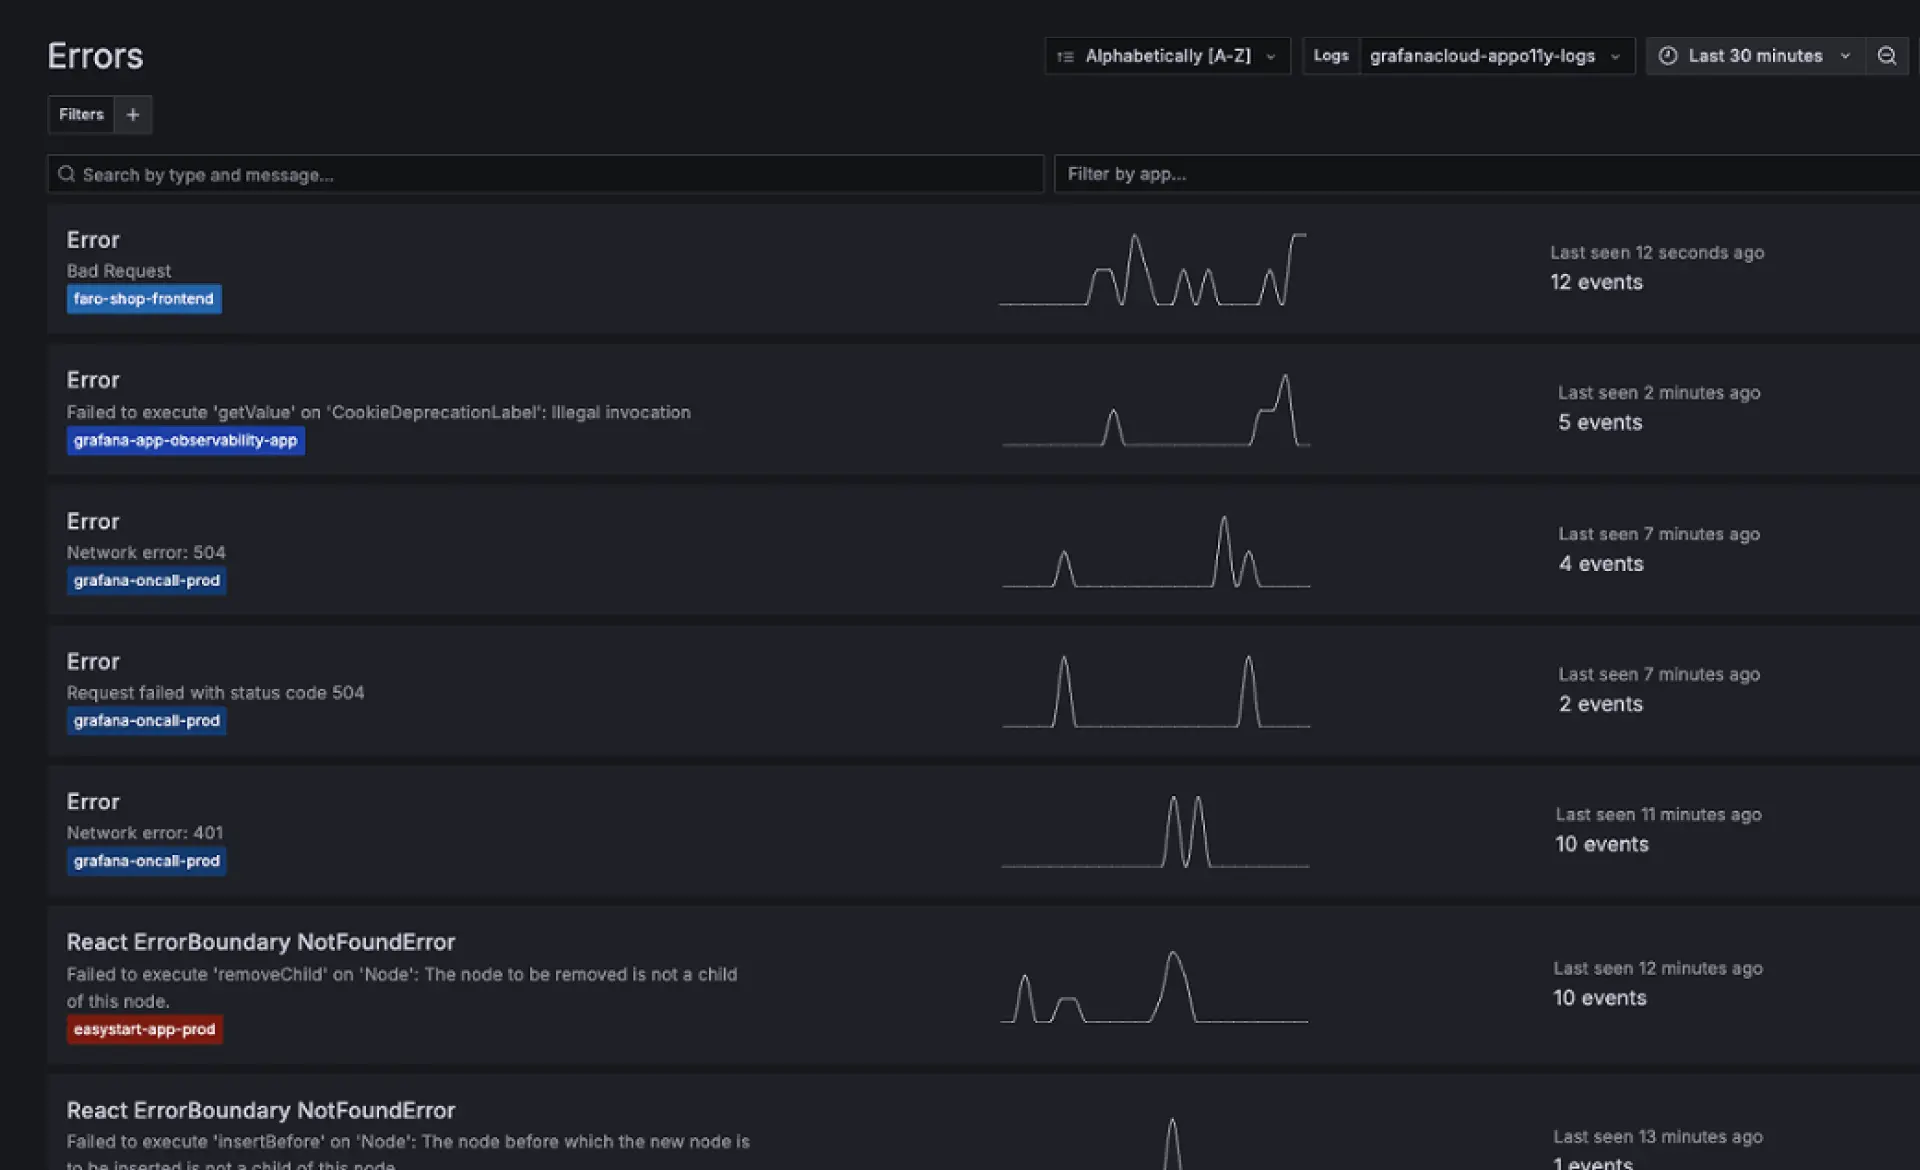
Track errors with complete stack traces
Prioritize frontend issues by severity, frequency, and impact. Rich error data and stack traces help you identify exactly where issues occur in the code and reduce time spent guessing root causes.
End-to-end visibility into every user interaction
Reconstruct user journeys through session timelines that combine frontend events with backend traces. This makes it easier to understand performance bottlenecks across network, rendering, and service layers.
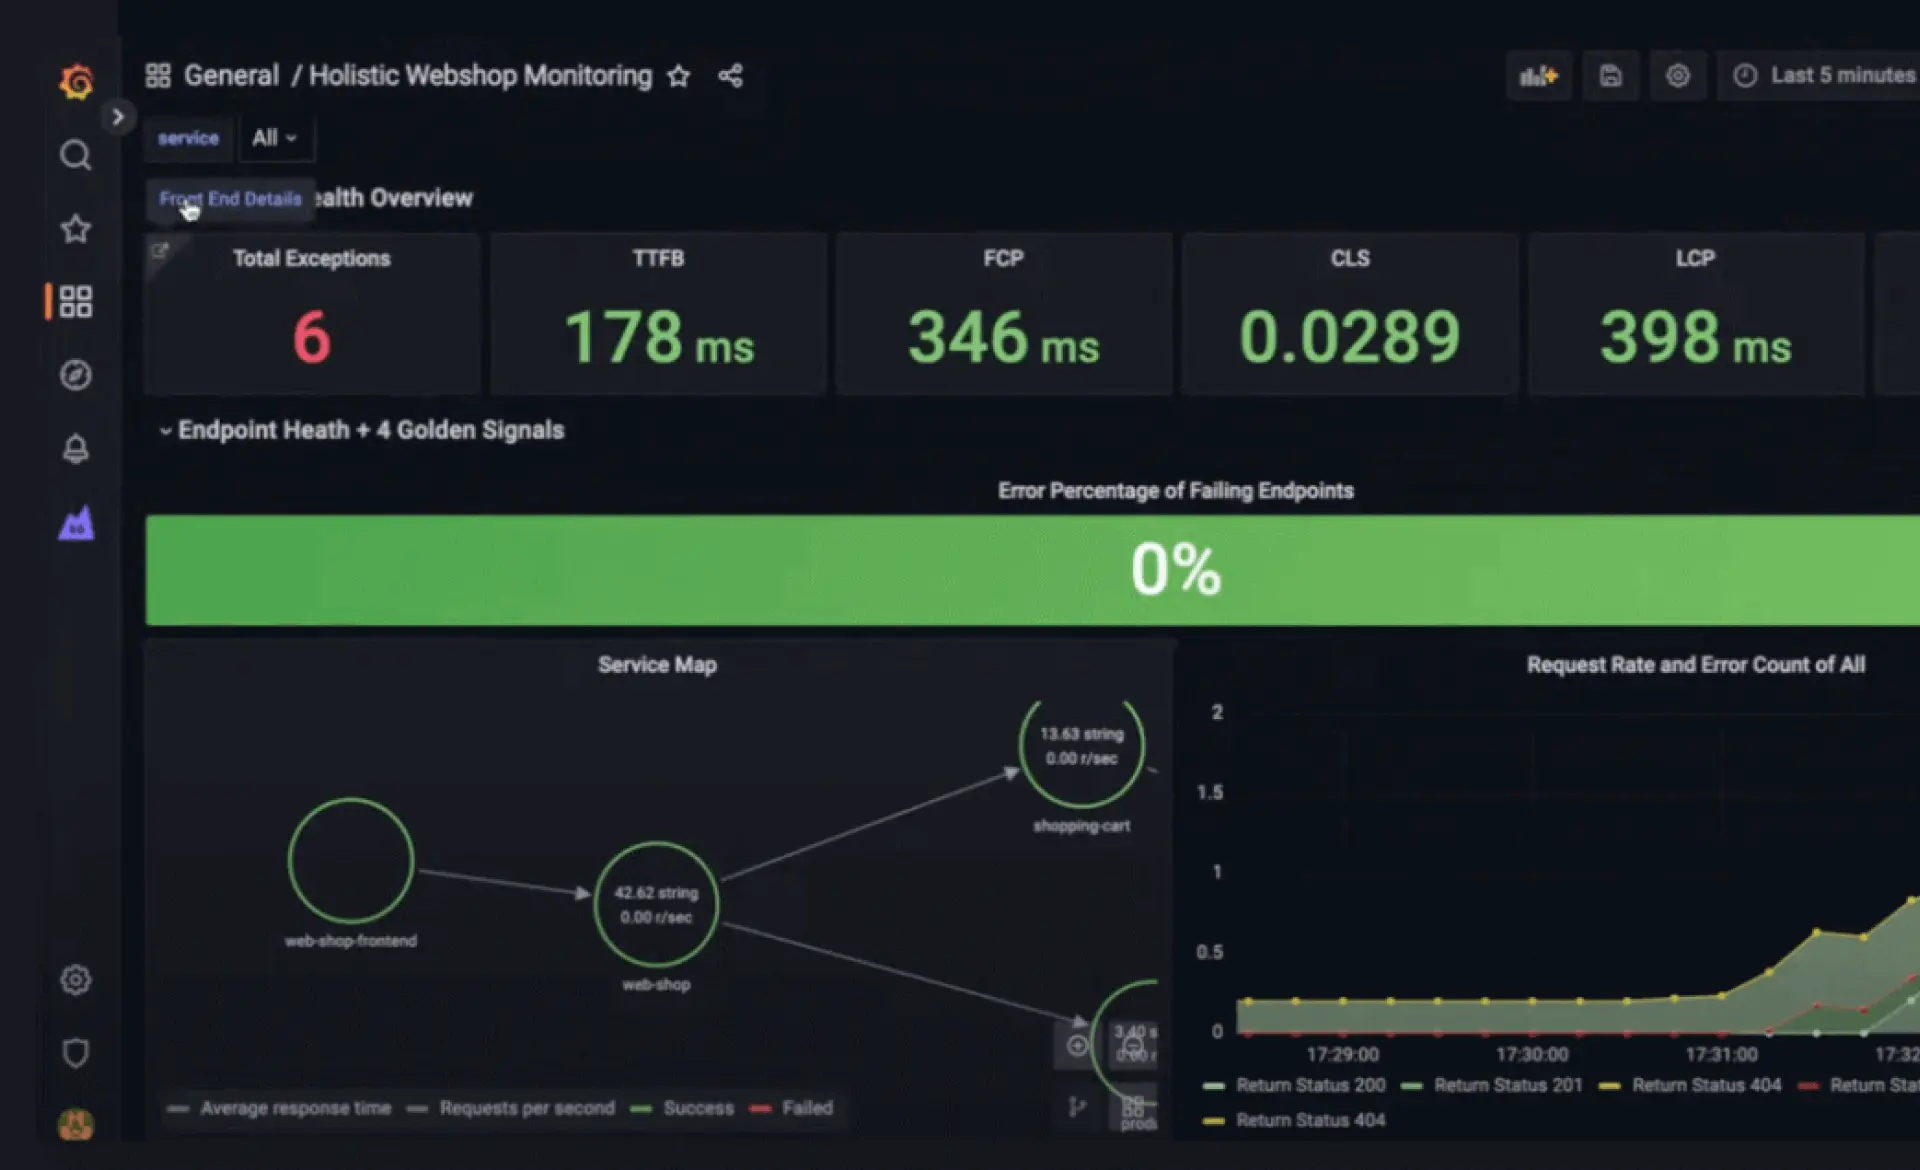
Build custom Grafana Cloud dashboards
Create custom dashboards tailored to different stakeholders using frontend performance data from logs and traces in Grafana Cloud. This allows teams to focus on the metrics that matter to them without losing overall system context.
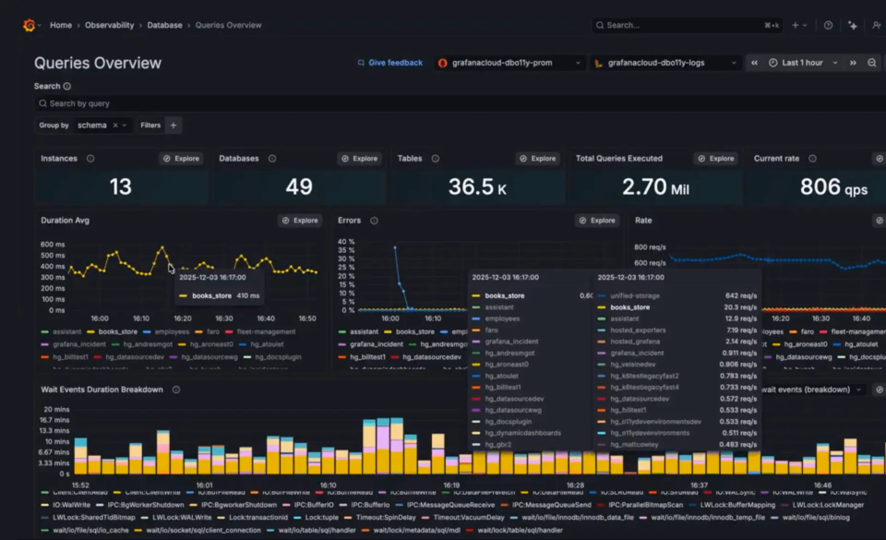
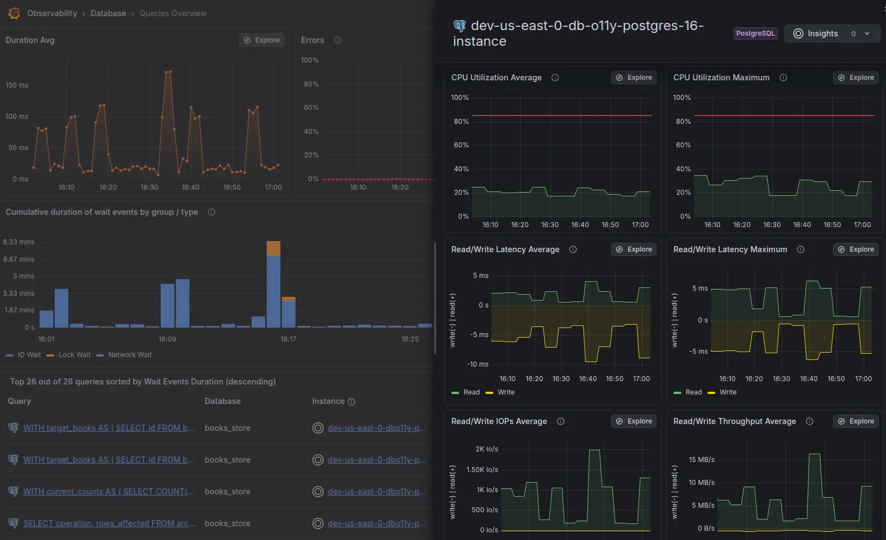
Database observability | Faster insight into query performance and database bottlenecks.
Grafana Cloud helps teams connect slow queries with system signals like CPU, memory, and I/O usage to understand how database performance is affected under load. Engineers can move from detecting slowdowns to identifying the exact queries and execution paths behind them, making root cause analysis faster and more precise. For MySQL and PostgreSQL environments, it also highlights inefficient queries and missing indexes to improve performance over time. At amasol, we help teams operationalize database observability by structuring telemetry clearly and enabling engineers to focus on resolving performance issues instead of managing complex observability data.
Contextualize database health
Grafana Cloud connects database performance with upstream services using the Entity Catalog and Knowledge Graph. This helps teams understand how slow queries and resource contention impact overall system behavior. Database metrics can also be combined with infrastructure signals to identify saturation and performance bottlenecks across services.
Deep dive diagnostics
Filter and analyze queries by latency, errors, or execution time to isolate performance issues. Visual explain plans help uncover inefficient operations like full table scans, while normalized query patterns make it easier to detect regressions over time.
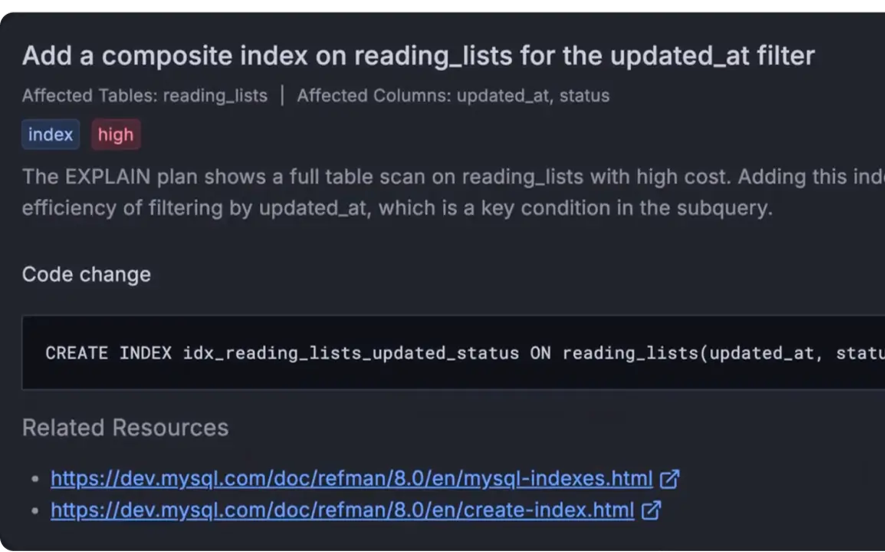
Ship fixes with AI-generated DDL
AI-assisted analysis highlights optimization opportunities such as missing indexes and inefficient queries. Teams can generate and apply ready-to-use SQL changes, helping speed up remediation and reduce manual tuning effort.
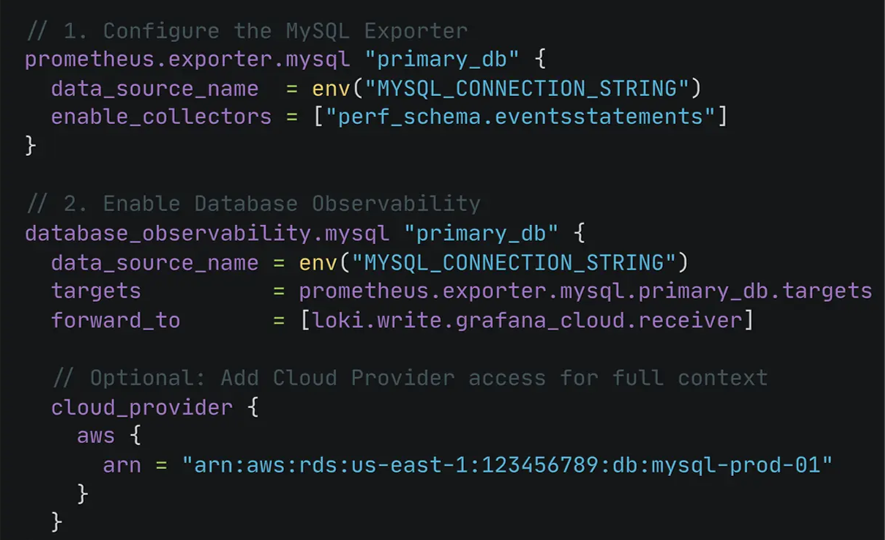
Set up with open standards
Deploy database observability using open tooling with Alloy collectors for MySQL and PostgreSQL. This approach supports cloud databases like RDS, Aurora, CloudSQL, and Azure Database while allowing secure handling of sensitive data through built-in SQL redaction.
LGTM | the foundation of Grafana Cloud observability
The LGTM stack is the core of Grafana Cloud, built around logs, metrics, traces, and Grafana as the visualization layer. It provides a unified, open-source foundation for understanding system behavior across your entire infrastructure. Powered by tools like Loki, Tempo, and the Prometheus ecosystem extended by Grafana Mimir, it brings telemetry data together so teams can correlate signals and troubleshoot issues without switching between isolated systems. This open approach avoids vendor lock-in and gives teams a consistent way to scale observability across complex environments. amasol designs and operates LGTM-based observability setups that are structured, reliable, and aligned with how your systems actually run in production.
Loki (Logs)
Loki stores logs as streams of labeled data instead of full-text indexing. This makes it highly efficient to operate at scale while still allowing full log content search when needed. Labels are used to narrow queries, reducing noise and improving query performance.
Grafana (Visualization & Dashboard)
Grafana Cloud provides the visualization and exploration layer for observability data. It connects metrics, logs, and traces from any source into dashboards that support querying, alerting, and analysis without requiring data migration.
Tempo (Traces)
Tempo stores distributed traces without indexing every span, enabling cost-efficient storage at high volume. It allows teams to trace requests end-to-end, generate metrics from traces, and quickly identify latency or error sources across services.
Mimir & Prometheus (Metrics)
Grafana Mimir extends Prometheus into a scalable, long-term metrics system. It supports high-volume time-series data storage using object storage, enabling global visibility, long retention, and fast PromQL queries across large environments.
Skip the learning curve and simplify your workflow
Use AI-assisted setup and natural language queries to build dashboards and explore data faster. This reduces onboarding time and makes complex observability workflows accessible to users at any level.
Accelerate root cause analysis with agentic investigations
Assistant Investigations uses AI-driven correlation across your stack to detect anomalies early and speed up incident understanding. By leveraging contextual insights from the SRE agent and the Grafana Cloud knowledge graph, teams can identify root causes faster and focus on resolving impact rather than manual triage.
Empower your entire team to take action
Break down knowledge silos by enabling teams to interact with observability data through AI-generated insights. Automate routine tasks such as incident summaries, log explanations, and initial error analysis to reduce cognitive load and improve response efficiency.
Scale securely with the tools you already use
Manage access and governance through role-based controls while maintaining compliance with standards such as SOC 2, GDPR, and CCPA. Integrated directly into Grafana Cloud, the assistant supports secure collaboration across Slack, MCP servers, and the Grafana interface without disrupting workflows.
Grafana AI Assistant | for when you need faster and smarter observability
Grafana Cloud includes an AI Assistant that lets you query and explore observability data using natural language. It can generate queries, build dashboards, and support investigations across logs, metrics, and traces without requiring advanced query knowledge. It helps teams move faster from raw telemetry to understanding issues by surfacing relevant signals and explaining anomalies directly inside Grafana Cloud. At amasol, we help integrate Grafana Assistant into real workflows, ensuring teams can use it effectively for faster troubleshooting and simpler interaction with observability data.

Grafana | Dashboard anything. Observe everything.
Grafana lets you query, visualize, and monitor your data wherever it lives. You can build flexible dashboards to explore information, track system behavior, and share insights across your teams. With amasol, we help you turn this capability into a working observability setup. We design and implement your Grafana environment, connect your data sources, and ensure your dashboards reflect the systems you actually run so your teams get clarity, not simply charts.
Understand your systems without moving your data
Grafana is able to visualize and explore your existing data wherever it lives without migration. It does not require you to ingest data to a backend store or vendor database.
Give every team the visibility they need
Data shouldn’t be limited to a single team. Grafana makes it easy for everyone to access and use the information they need, helping teams work with shared context and reducing data silos.
Turn data into actionable insights
Build dashboards that fit your needs using flexible queries and transformations. Grafana lets you shape and present data in a way that makes it easier to understand and act on.
Explore and visualize your data
Why use Grafana in Grafana Cloud?
Plugins
Connect your tools and your teams with Grafana plugins. Data source plugins hook into existing data sources via APIs and render the data in real time without requiring you to migrate or ingest your data.
Alerts
With Grafana Alerting, you can create, manage, and silence all of your alerts within one simple UI, allowing you to easily consolidate and centralize all of your alerts.
Transformations
Transformations allow you to rename, summarize, combine, and perform calculations across different queries and data sources.
Annotations
Annotate graphs with rich events from different data sources. Hover over events shows you the full event metadata and tags.
Panel editor
The panel editor makes it easy to configure, customize, and explore all of your panels with a consistent UI for setting data options across all of your visualizations.
Incident Response & Management (IRM) | turn alerts into actionable insights
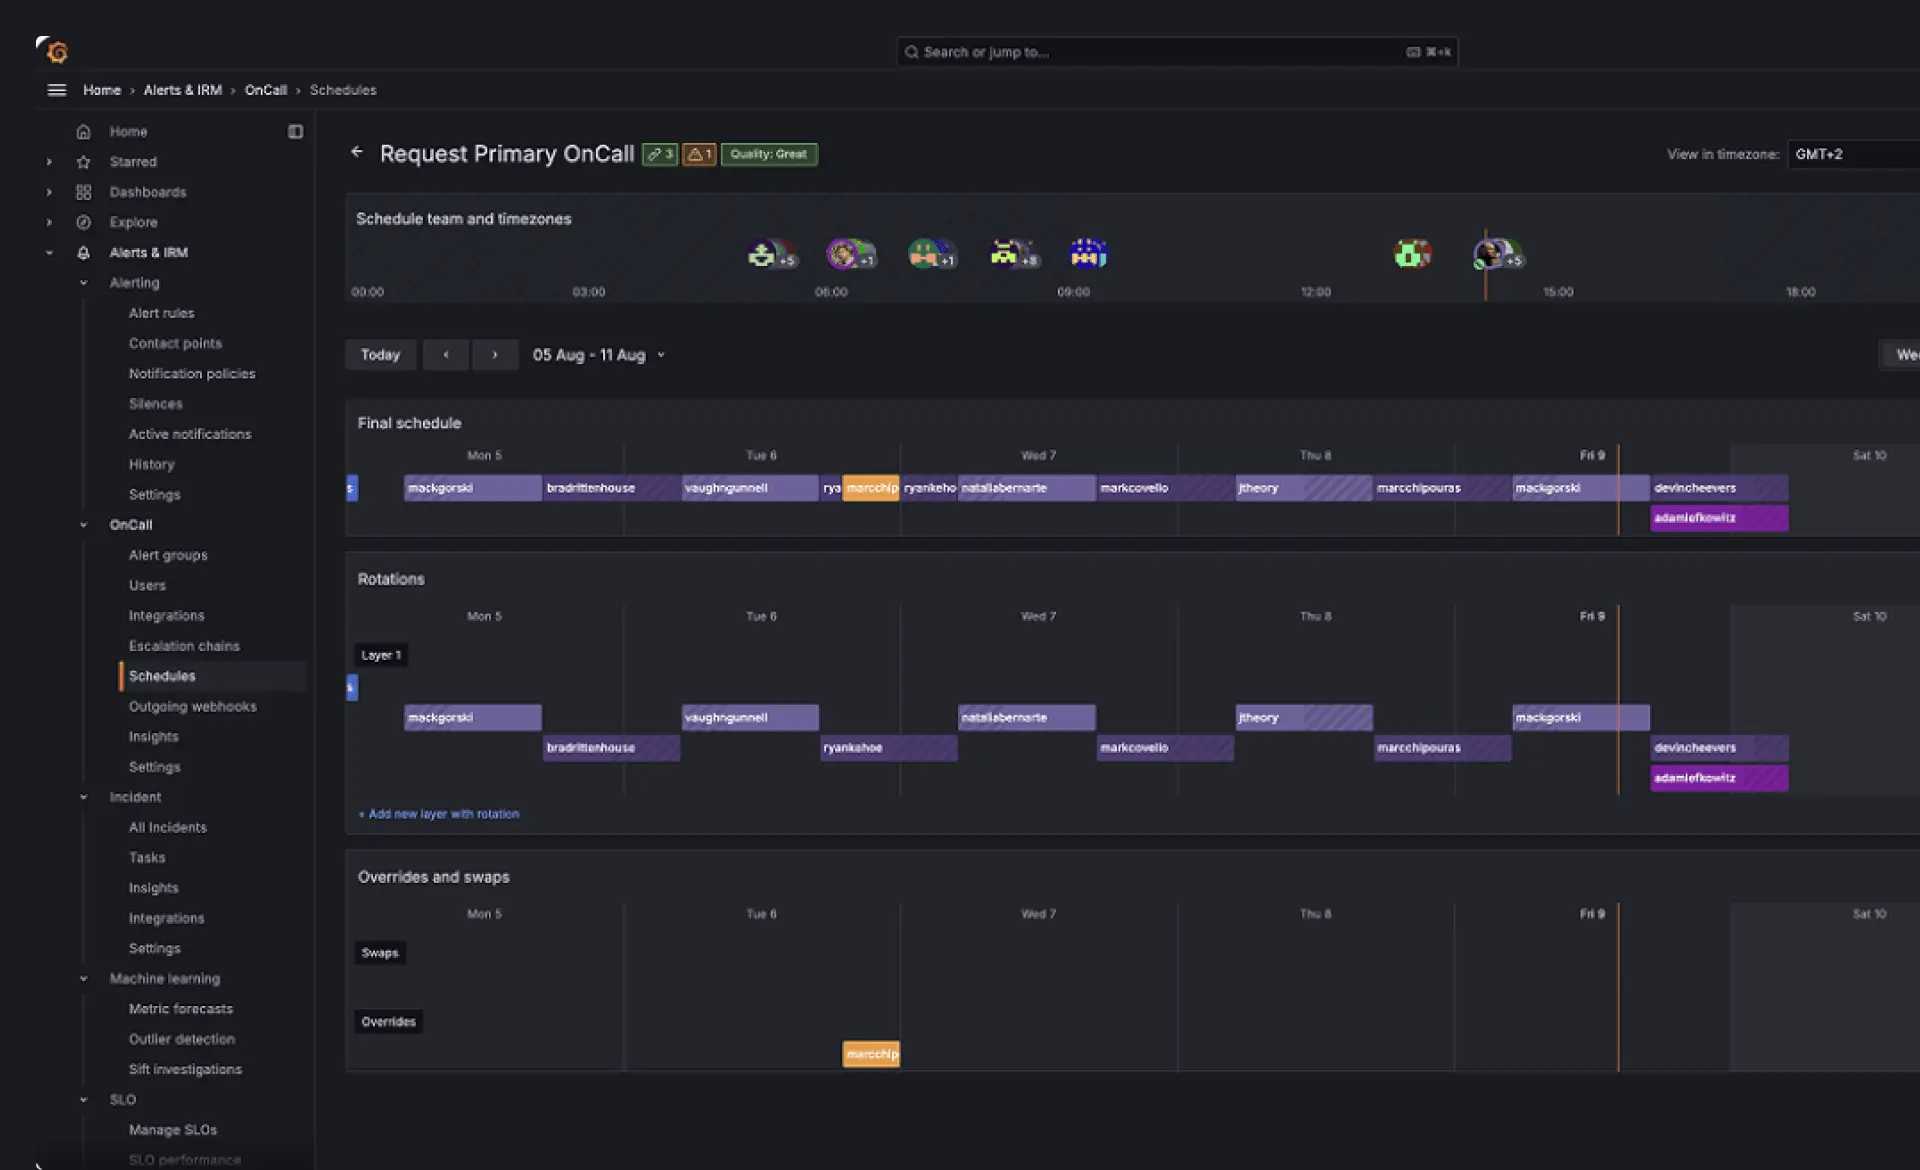
Grafana Cloud IRM helps you manage incidents through a single, unified workflow for alerts, on-call scheduling, and response. It brings alerting and incident coordination together so teams can detect, route, and resolve issues more efficiently. With amasol, we help you design and operate this setup end to end, configuring alert routing, structuring on-call processes, and integrating incident workflows into your existing systems so your teams can respond faster with less friction.
Respond to issues quickly and confidently
Tailor workflows so the right people have the right context to resolve issues fast and maintain 24/7 coverage.
Eliminate confusion before, during, and after incidents
Centralize communication, automate manual tasks, and maintain a clear view of incident progress from start to resolution.
Only pay for active users, nothing more
Costs scale only when engineers actively use Grafana Cloud IRM.
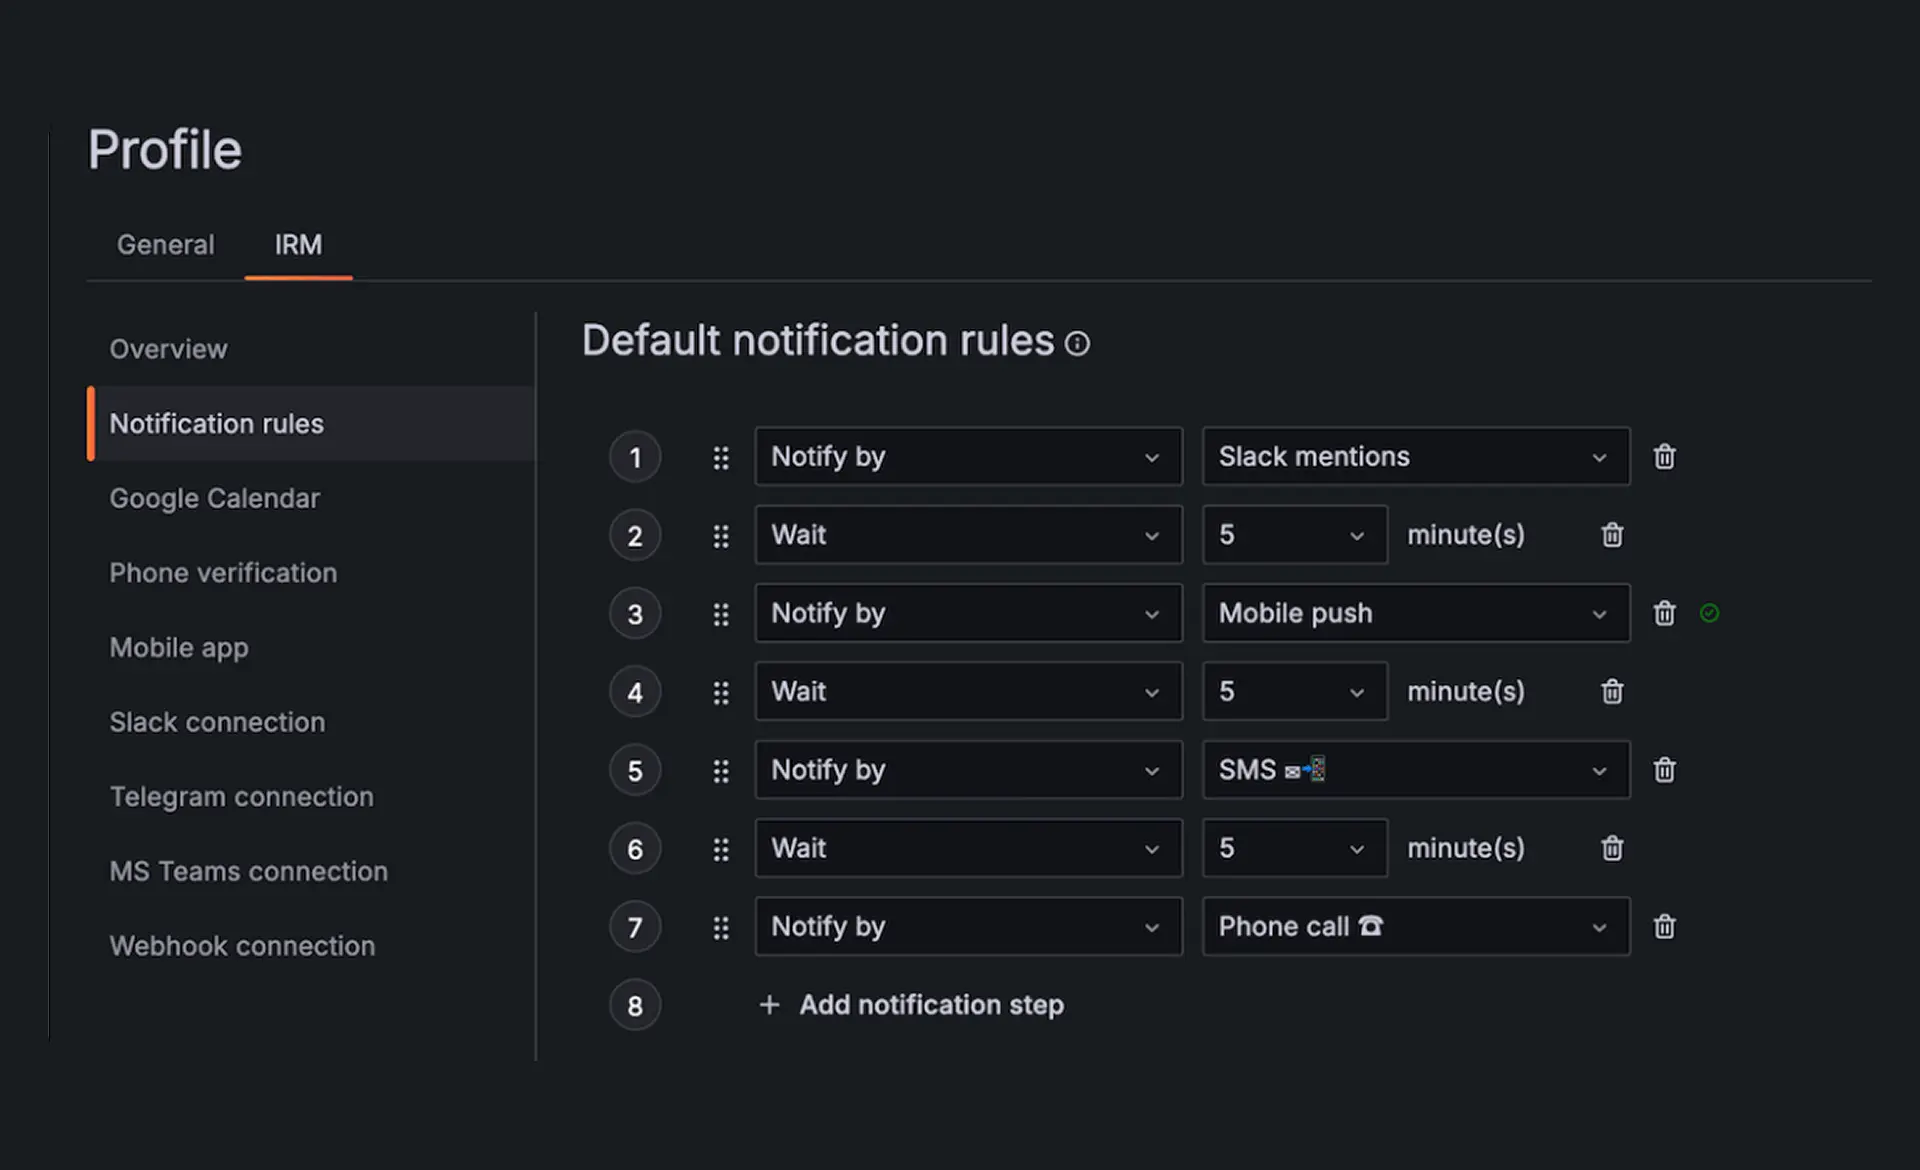
Notify the right people, at the right time
Alerts reach the right teams based on roles, responsibilities, and on-call context. Notifications are delivered through the tools teams already use, including Slack, Microsoft Teams, mobile apps, SMS, email, and phone calls. Alerts are routed to reduce noise and ensure relevant people are notified. Engineers can acknowledge, escalate, or resolve incidents directly from their communication channel, supported by automated escalation chains that remove delays in response.
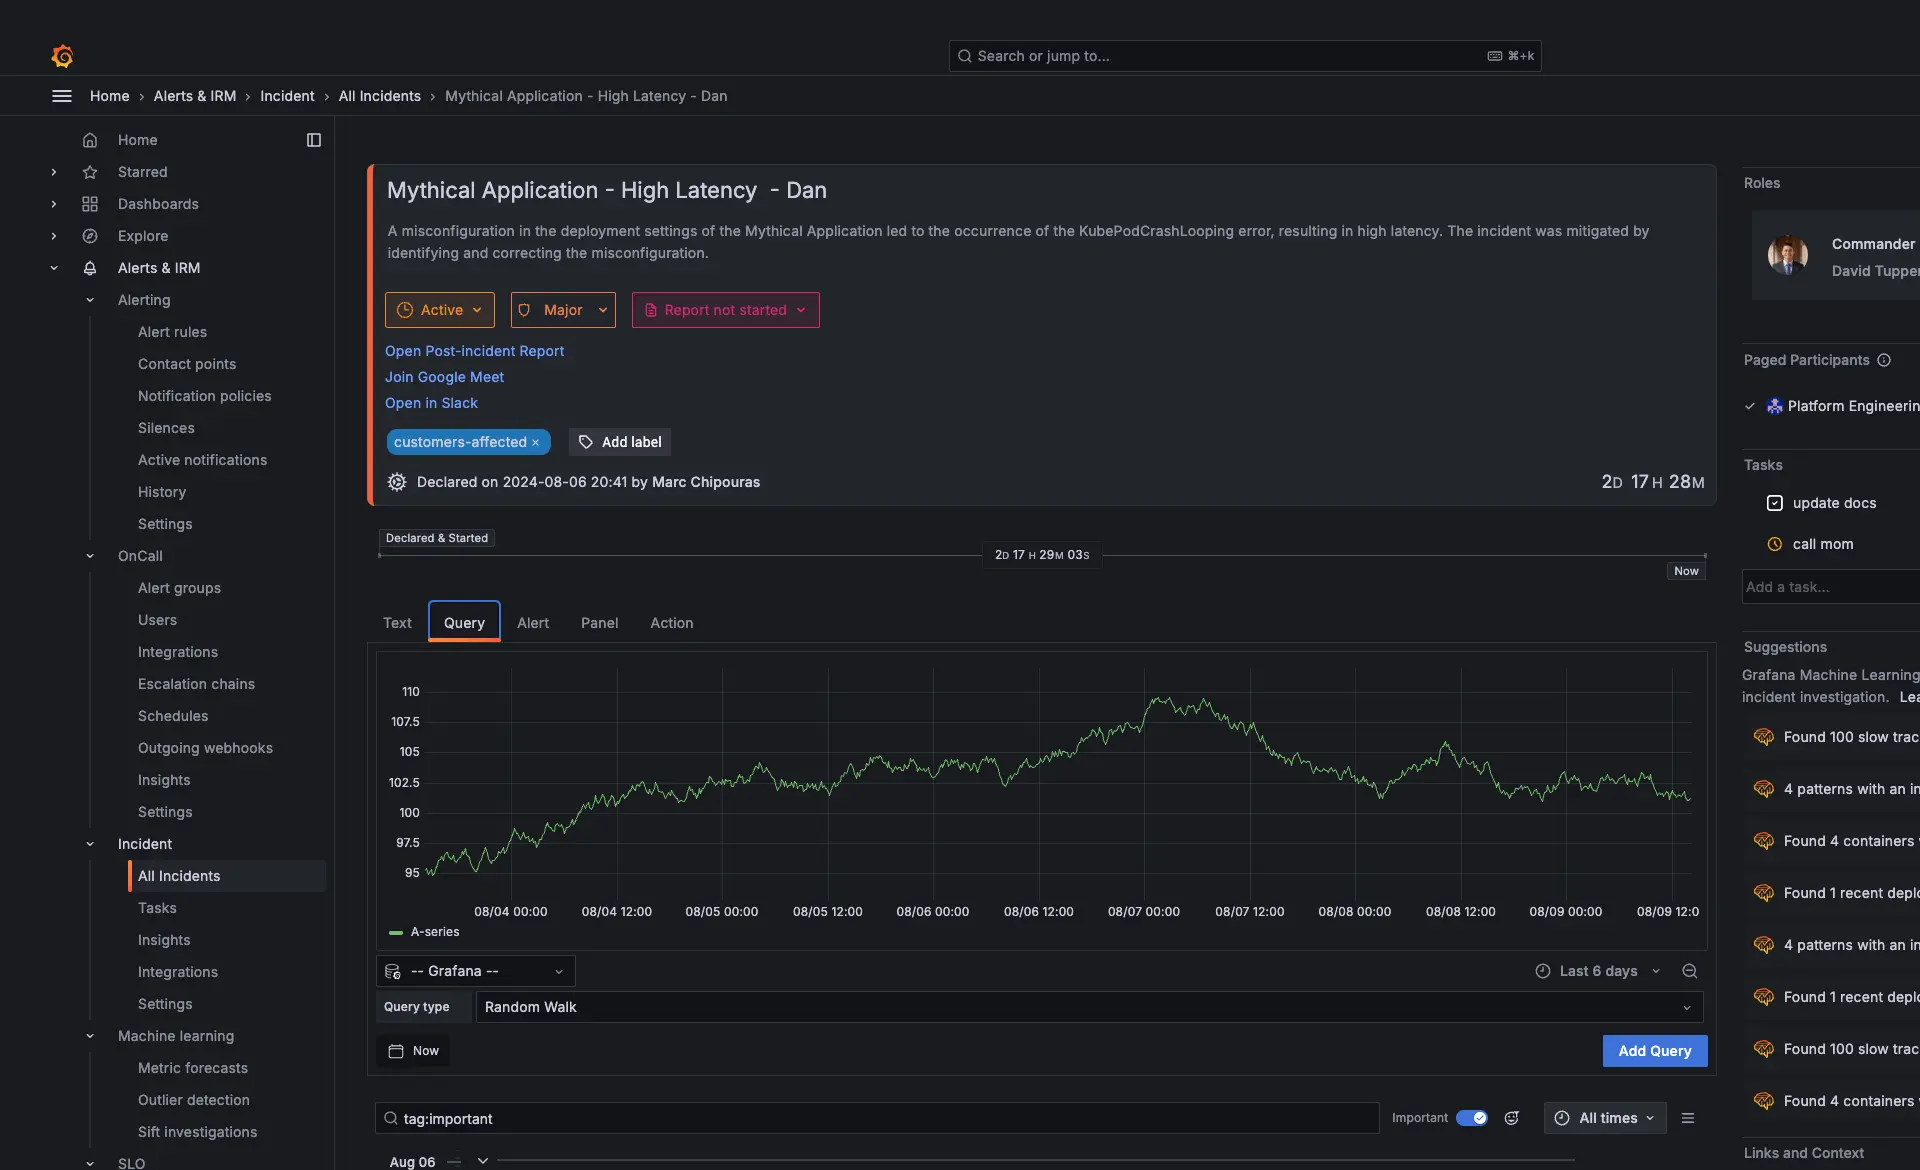
A single source of truth for incidents
All incident data is centralized into a single timeline that captures key events, decisions, and actions throughout the incident lifecycle. This provides a clear, structured view of what happened and when. Post-incident reviews can be generated directly from this timeline, creating a consistent record for learning and process improvement. Over time, teams can use this history to identify bottlenecks and improve response workflows.
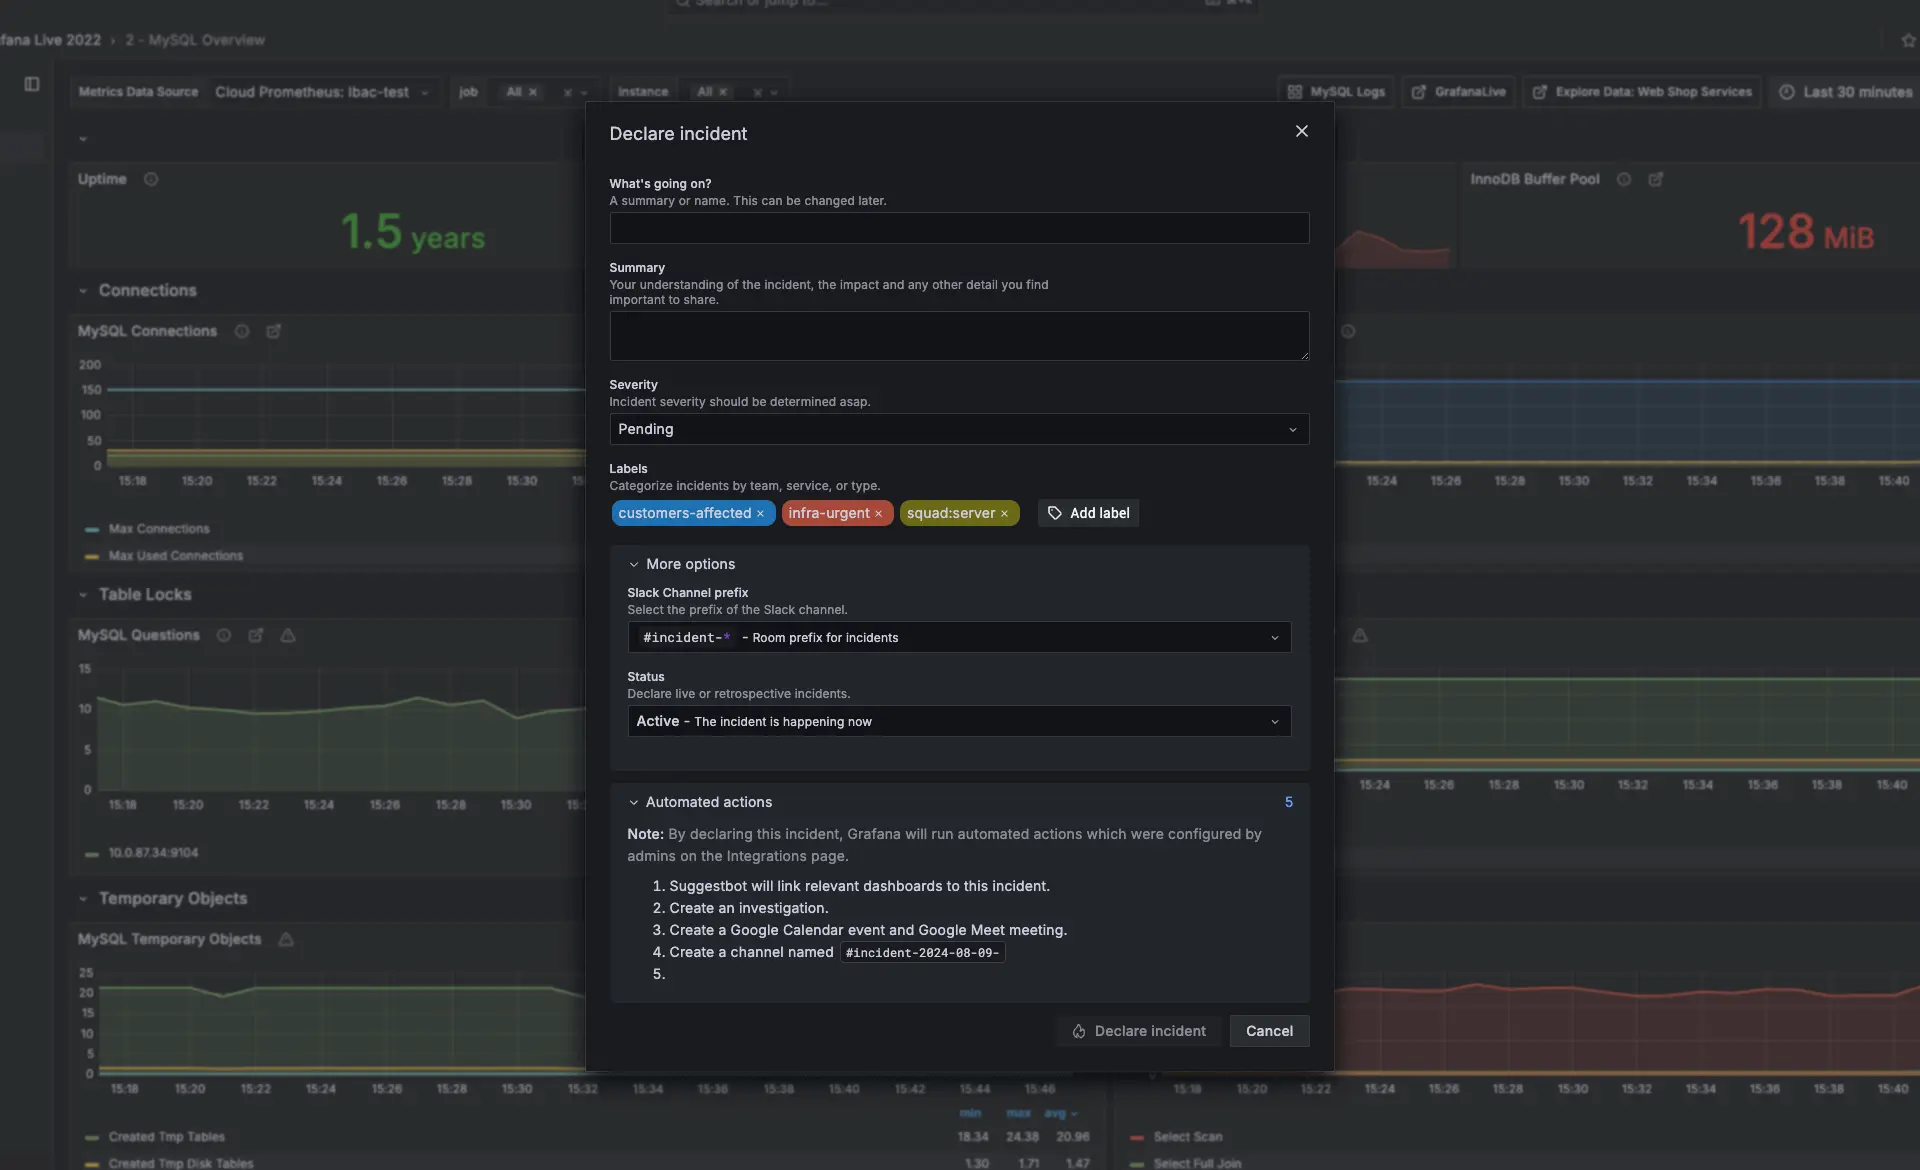
Respond to incidents from within your observability stack
Incidents can be initiated directly from Grafana dashboards when anomalies or performance issues are detected. This allows teams to move from detection to response without switching tools. IRM integrates with systems like Jira, ServiceNow, and GitHub to fit existing workflows while maintaining a consistent incident process. Tracking incident patterns over time helps teams refine response strategies and improve operational maturity.
IRM anywhere, anytime with the mobile app
The mobile experience provides real-time incident awareness with context-aware push notifications. Engineers can acknowledge, escalate, or resolve incidents directly from their device. On-call schedules, shift changes, and team availability can be managed on the go, ensuring continuous coordination even outside working hours. Critical alerts can bypass notification settings when immediate action is required.
Why use Grafana Cloud for incident response and management?
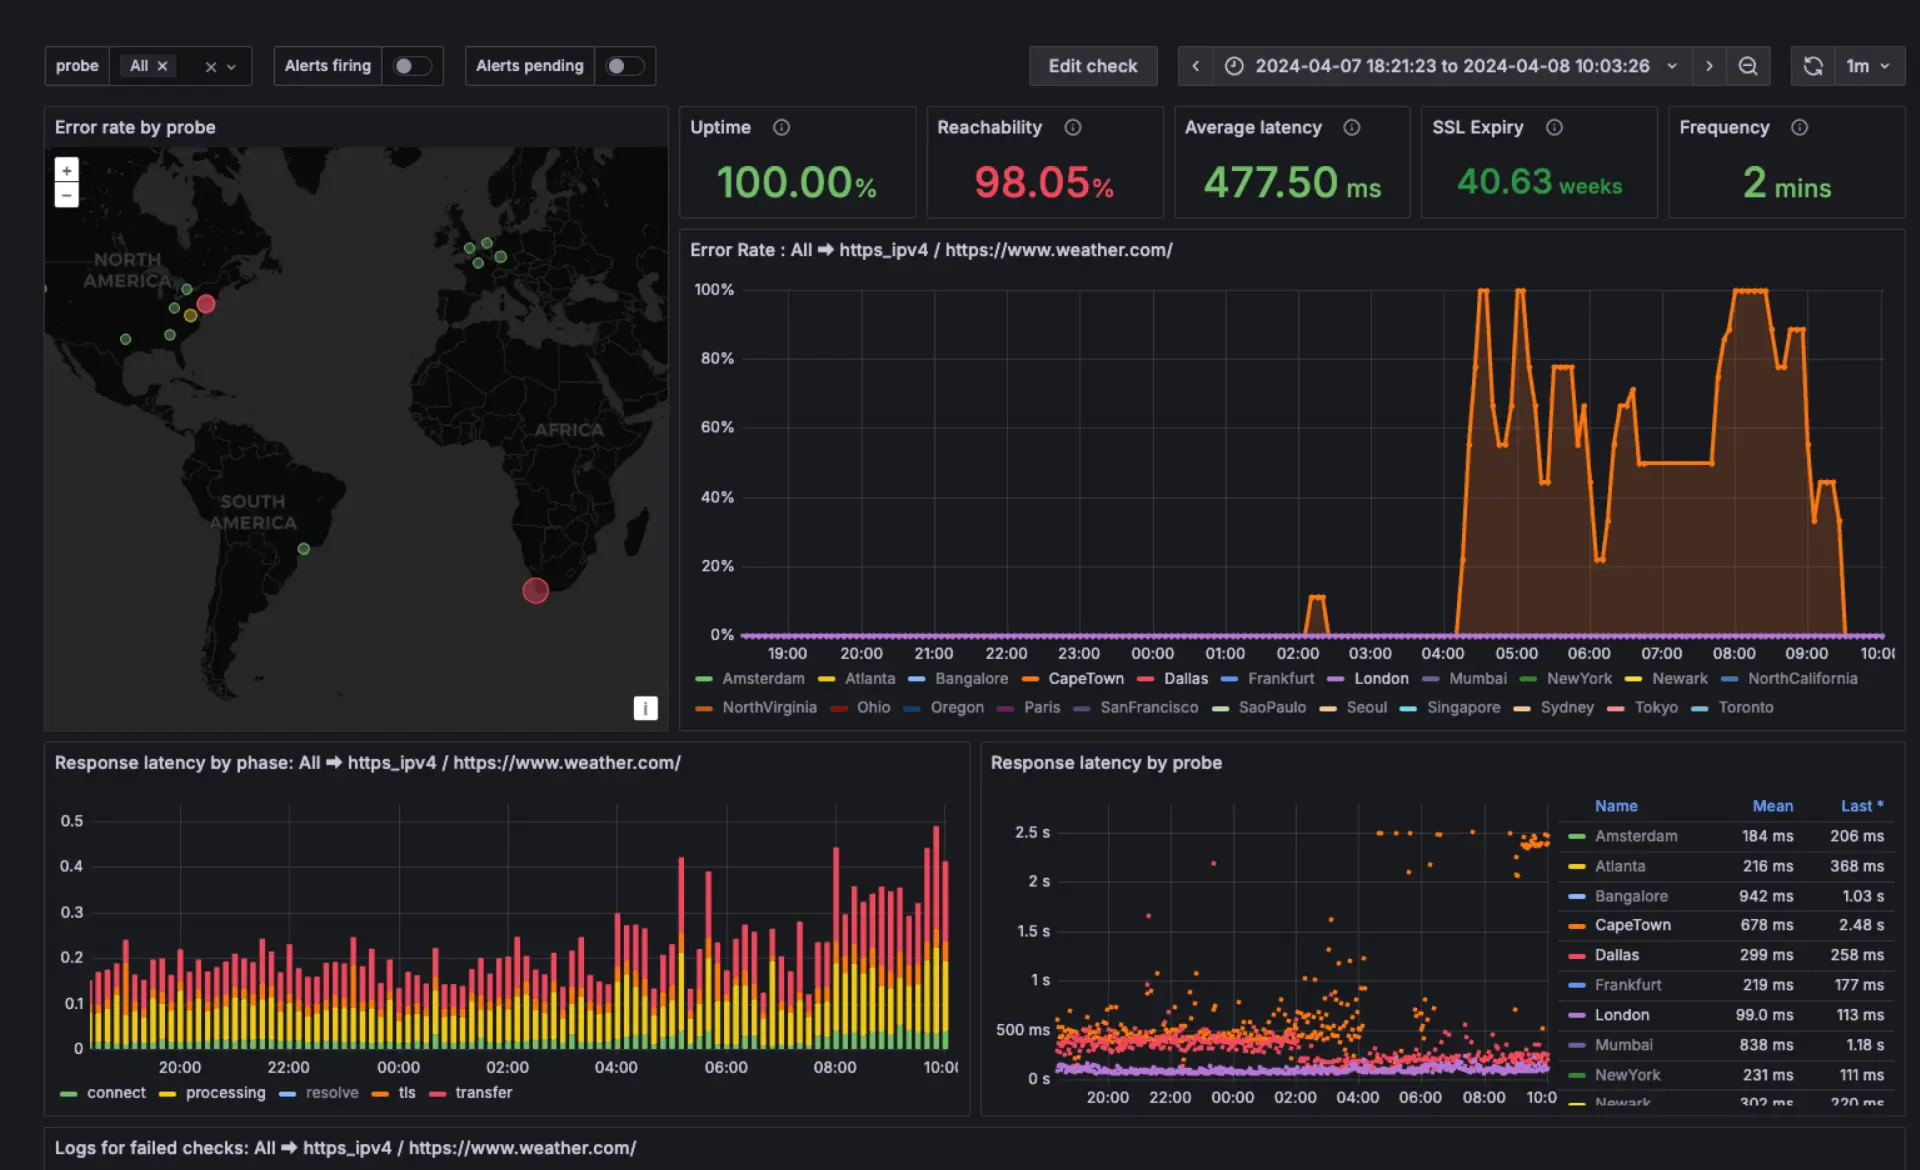
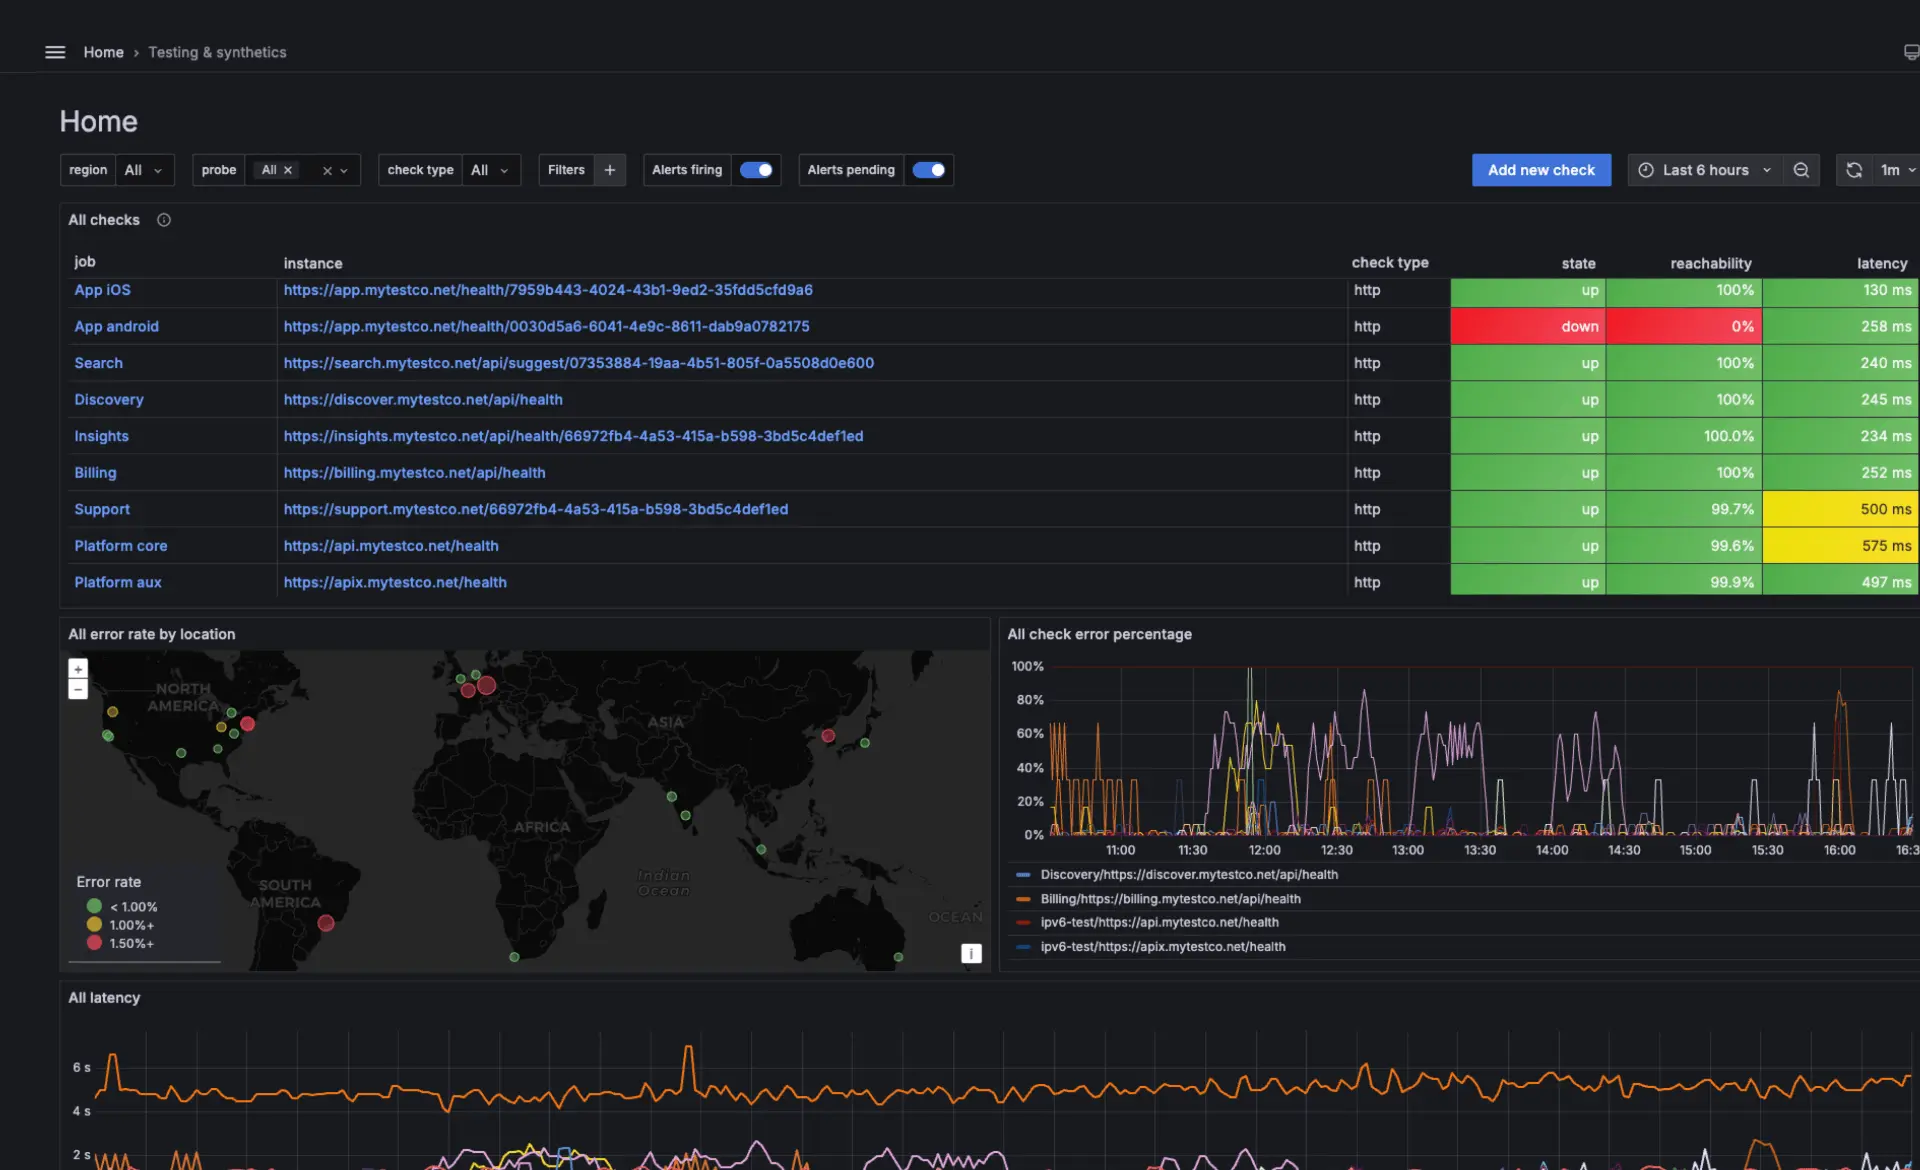
Synthetic monitoring | fake users, real results
Grafana Cloud Synthetic Monitoring, powered by k6, continuously tests websites, APIs, and critical user journeys from locations around the world to identify failures and performance issues early. At amasol, we help you define the most important user journeys, implement meaningful synthetic checks, and integrate them into your observability setup so you can detect problems before they impact users and maintain reliable digital services.
Stay on top of your SLOs
Grafana Cloud Synthetic Monitoring runs checks across multiple protocols including DNS, HTTP, HTTPS, TCP, and ping to validate system availability and performance. Tests can be executed from global probe locations to reflect real user access patterns, with failures visualized and alerted directly inside Grafana Cloud.
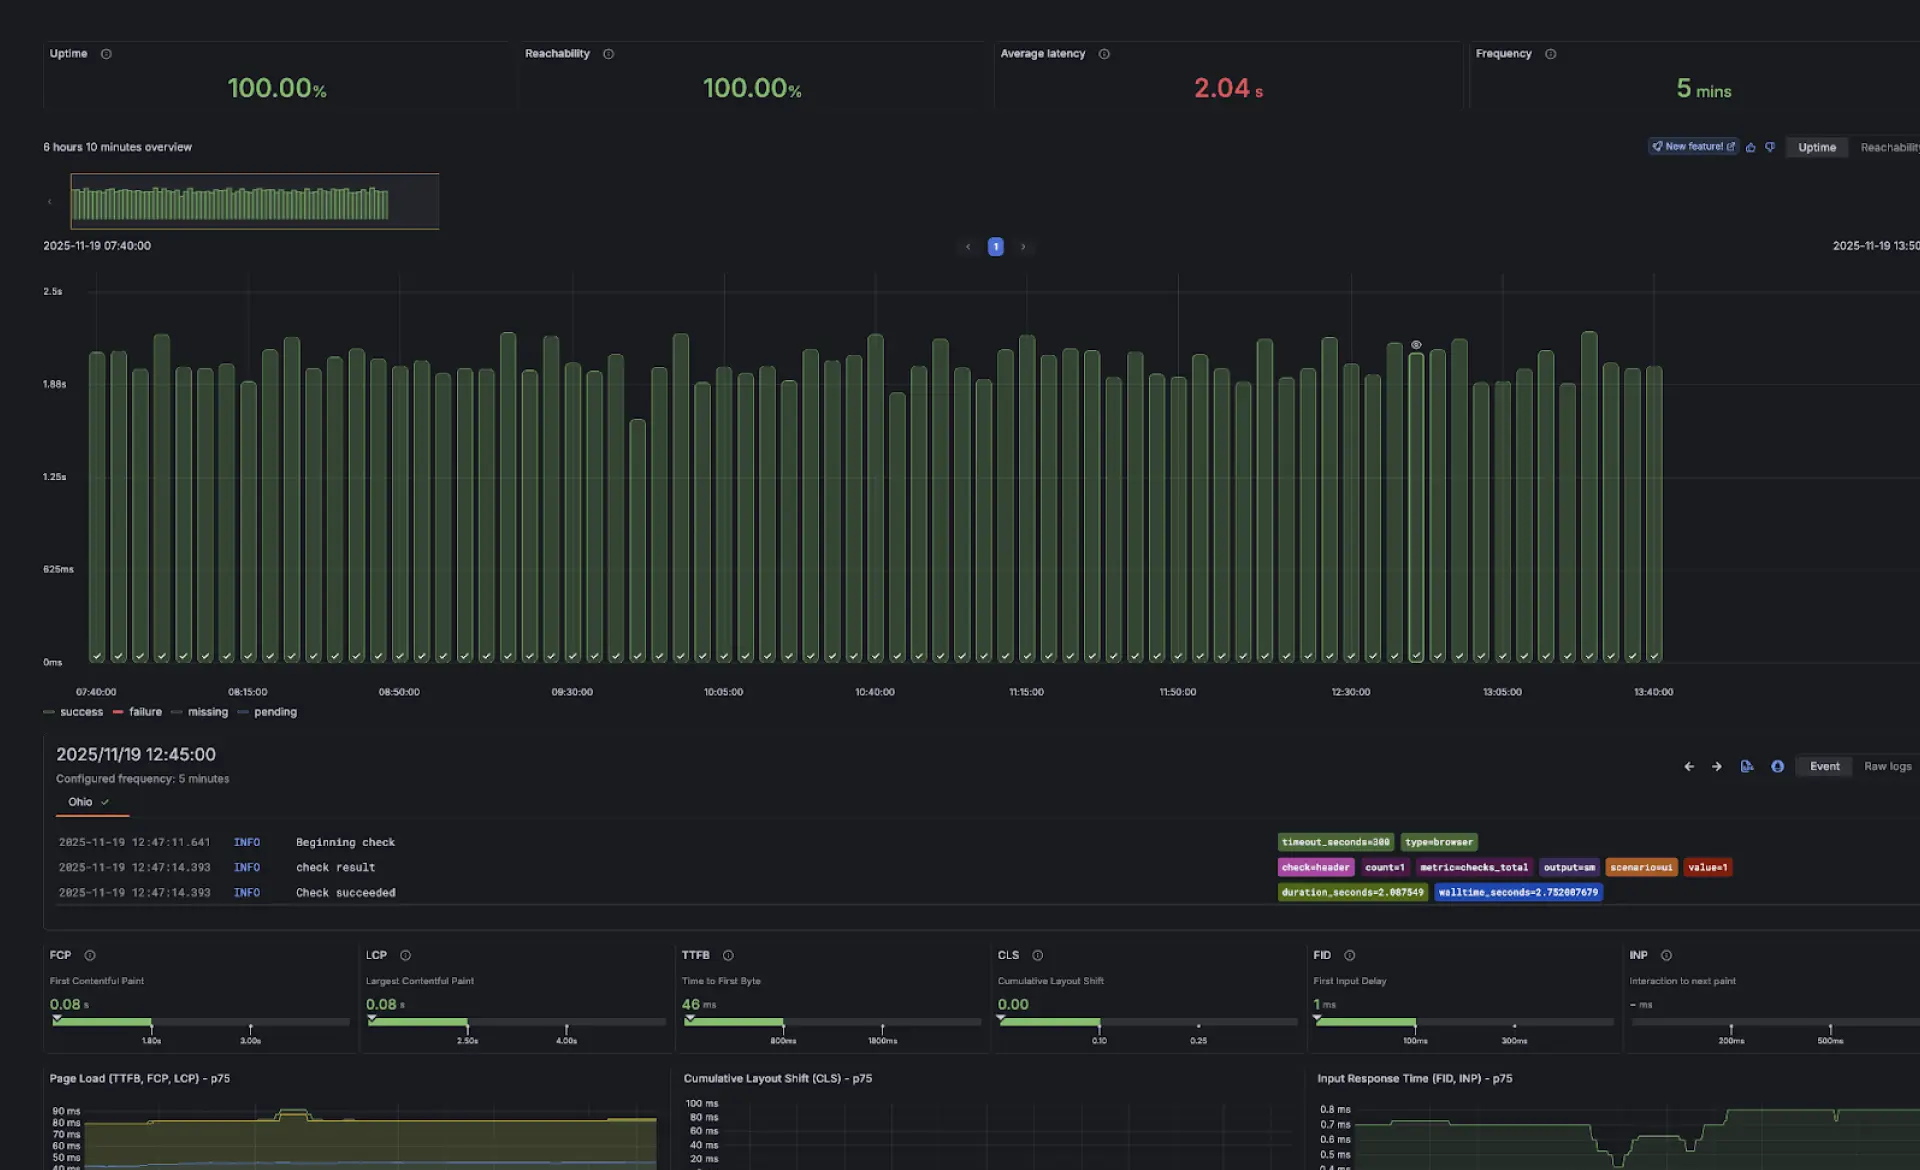
Validate critical user journeys
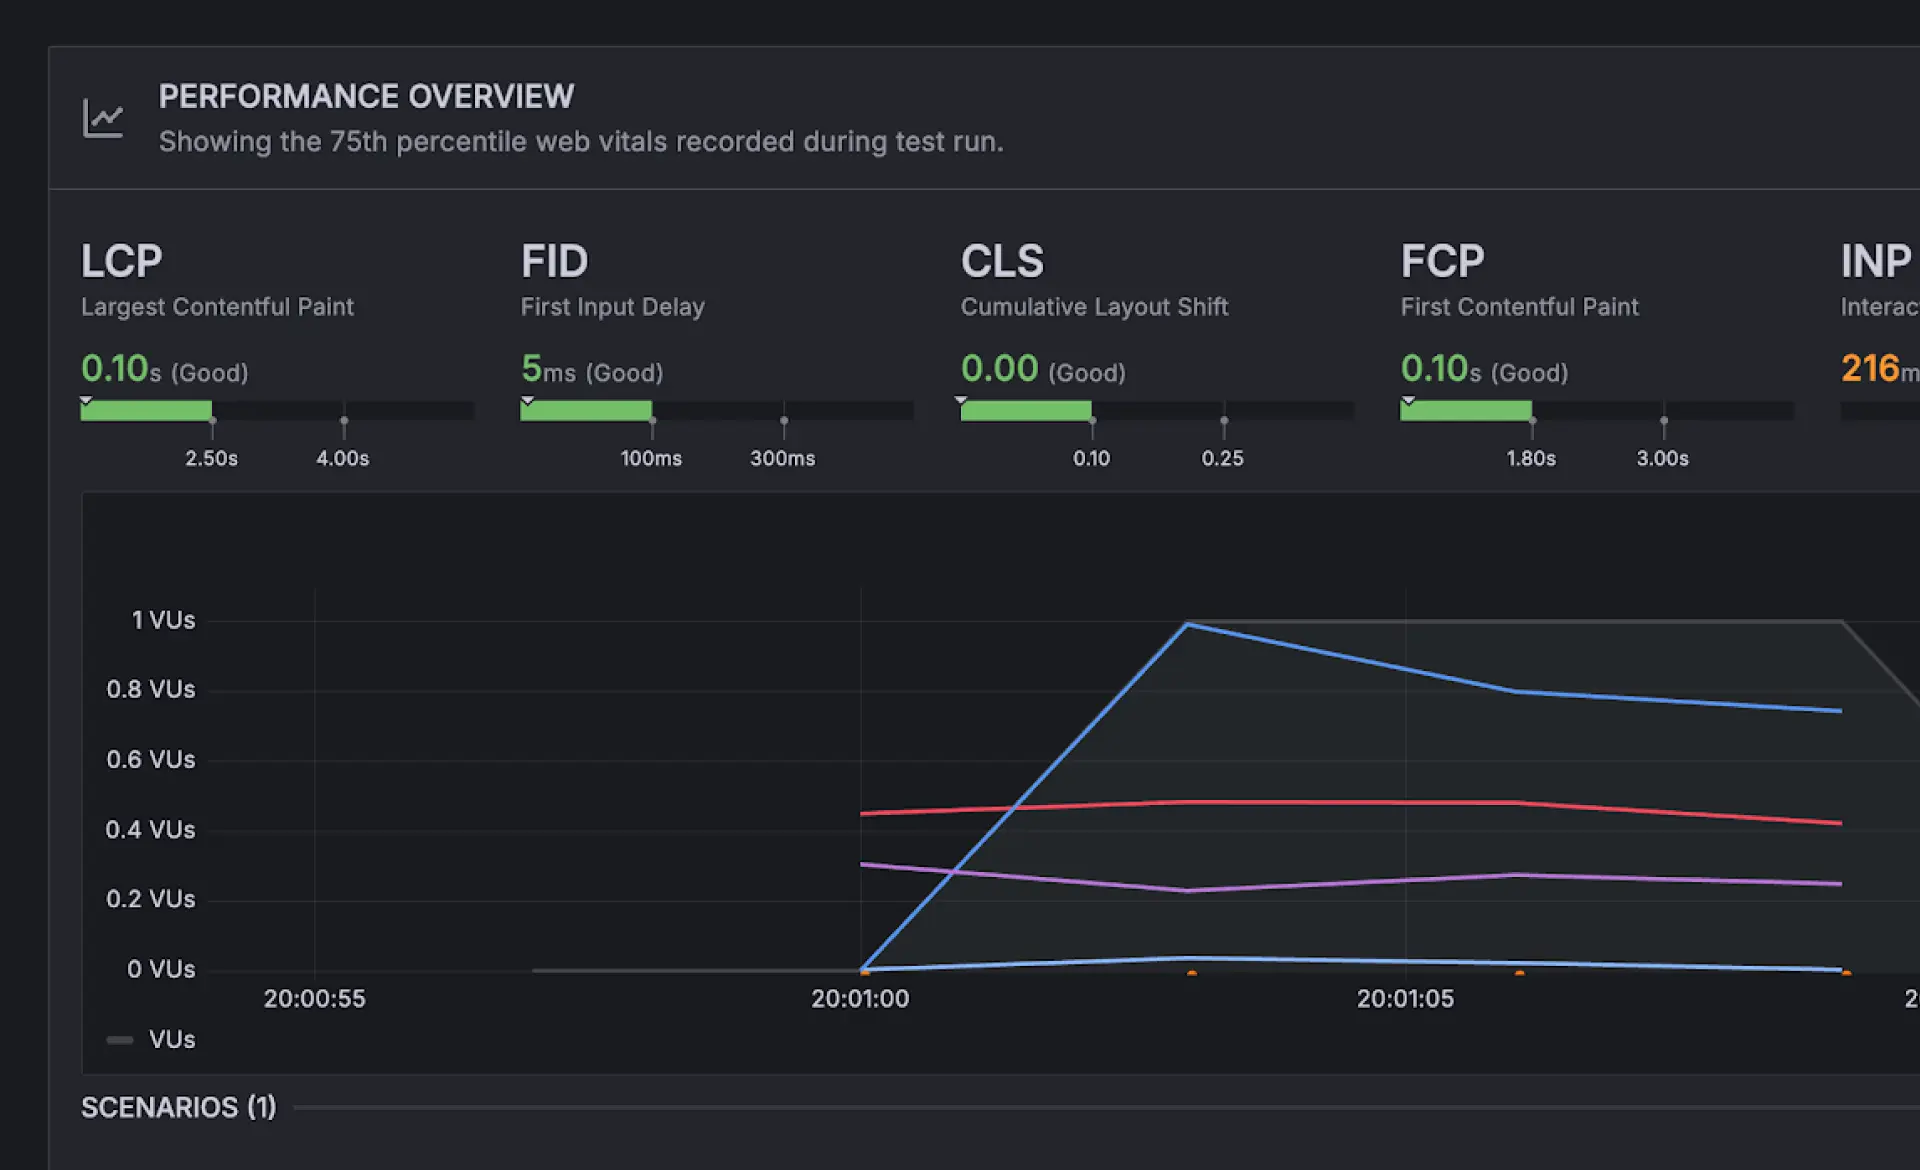
Browser-based tests simulate real user interactions to measure performance indicators such as Web Vitals and page load behavior. This helps teams identify bottlenecks in end-to-end workflows and understand how application changes affect real user experiences across different devices and environments.
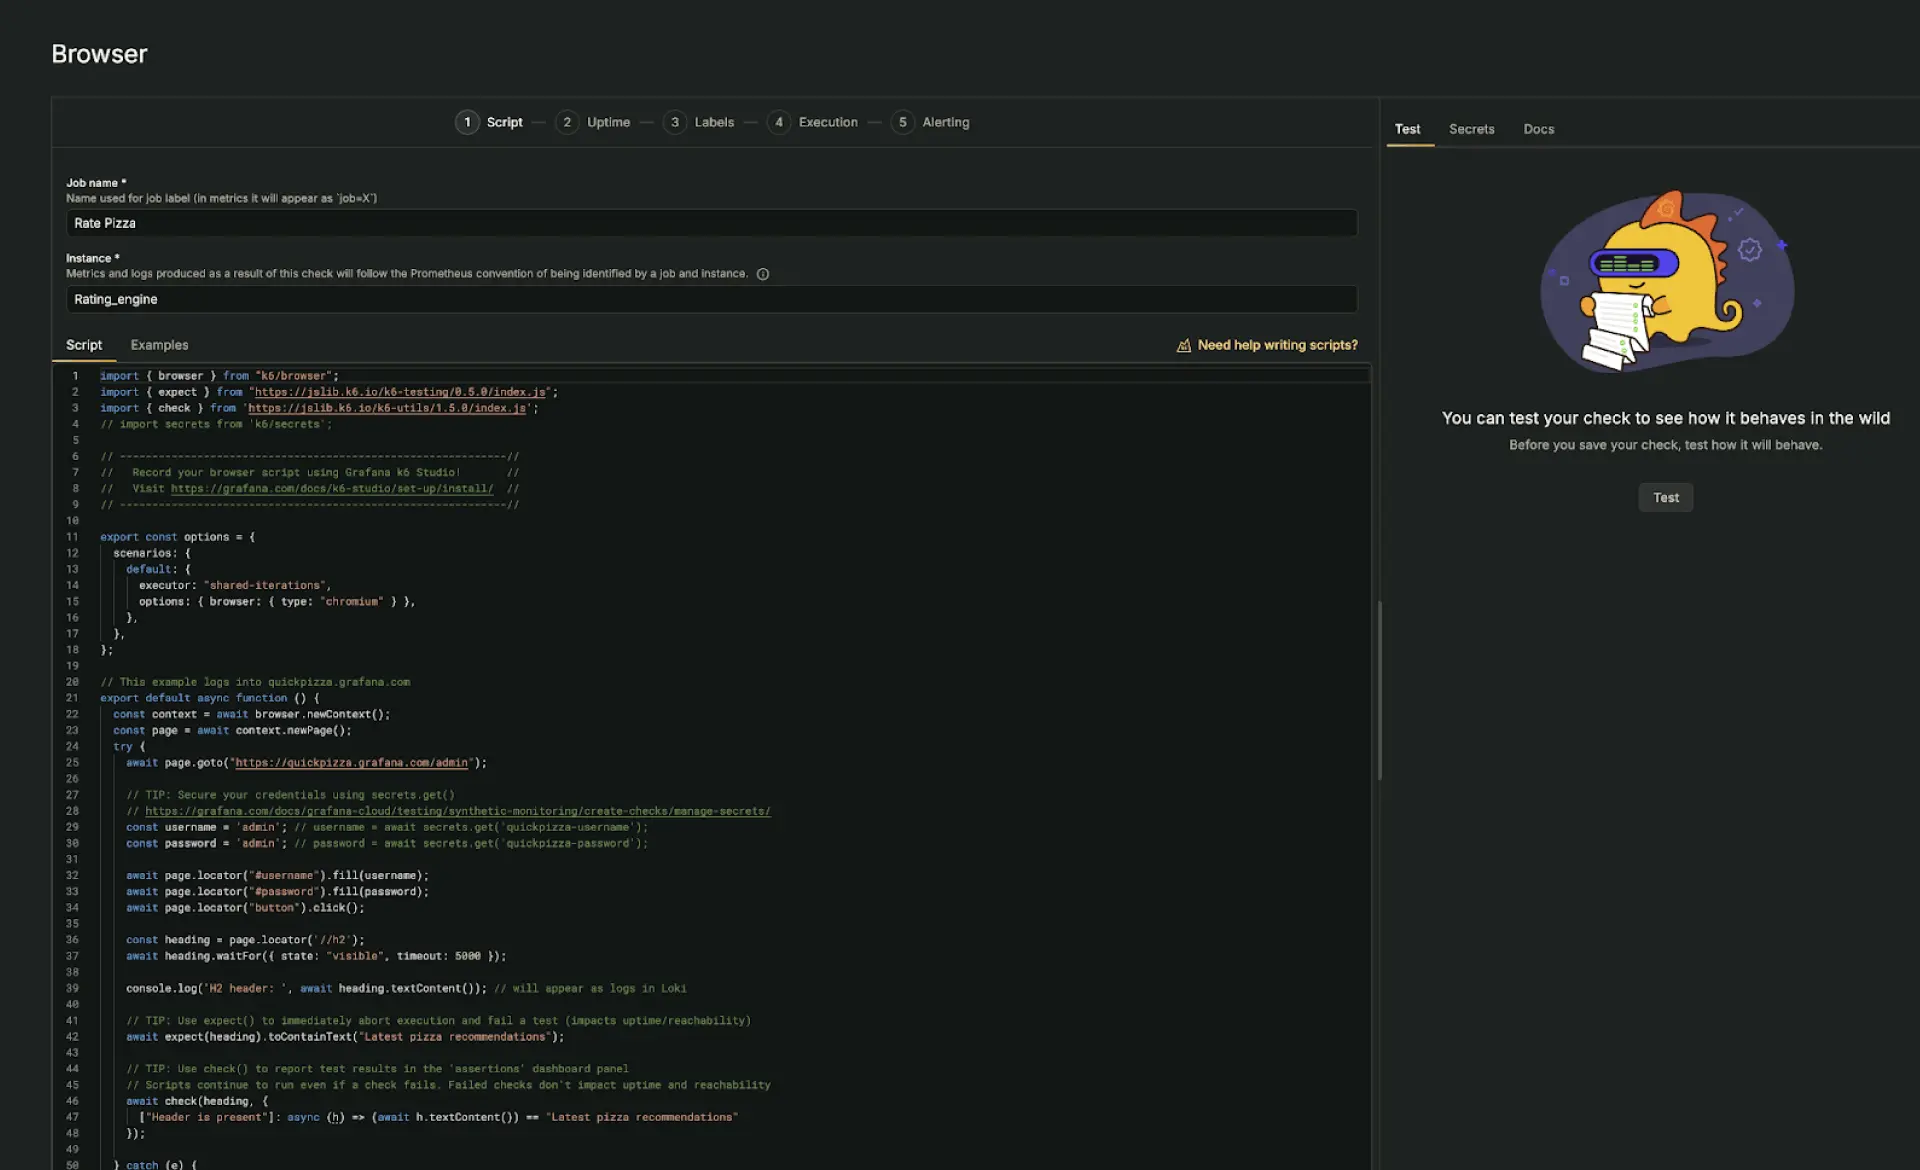
Shift left with reliability testing as code
Synthetic checks can be defined using JavaScript and the k6 API, allowing teams to version, reuse, and automate test logic across development workflows. These checks can be stored alongside application code and deployed through CI pipelines or infrastructure-as-code tools like Terraform.
Investigate and resolve issues faster
Synthetic results are combined with metrics, logs, and traces inside Grafana Cloud to support faster root-cause analysis. Teams can use built-in dashboards or build custom views to understand failures in context and track performance trends over time.
Improve reliability with shift-left testing
Grafana Cloud enables performance testing early in the development process by using k6 APIs, CLI, and JavaScript directly in workflows and IDEs. Tests can be automated through CI pipelines and scheduled from the web app, with SLOs used as success criteria. Realistic traffic patterns such as smoke, soak, and load tests help validate system behavior under real-world conditions before deployment.
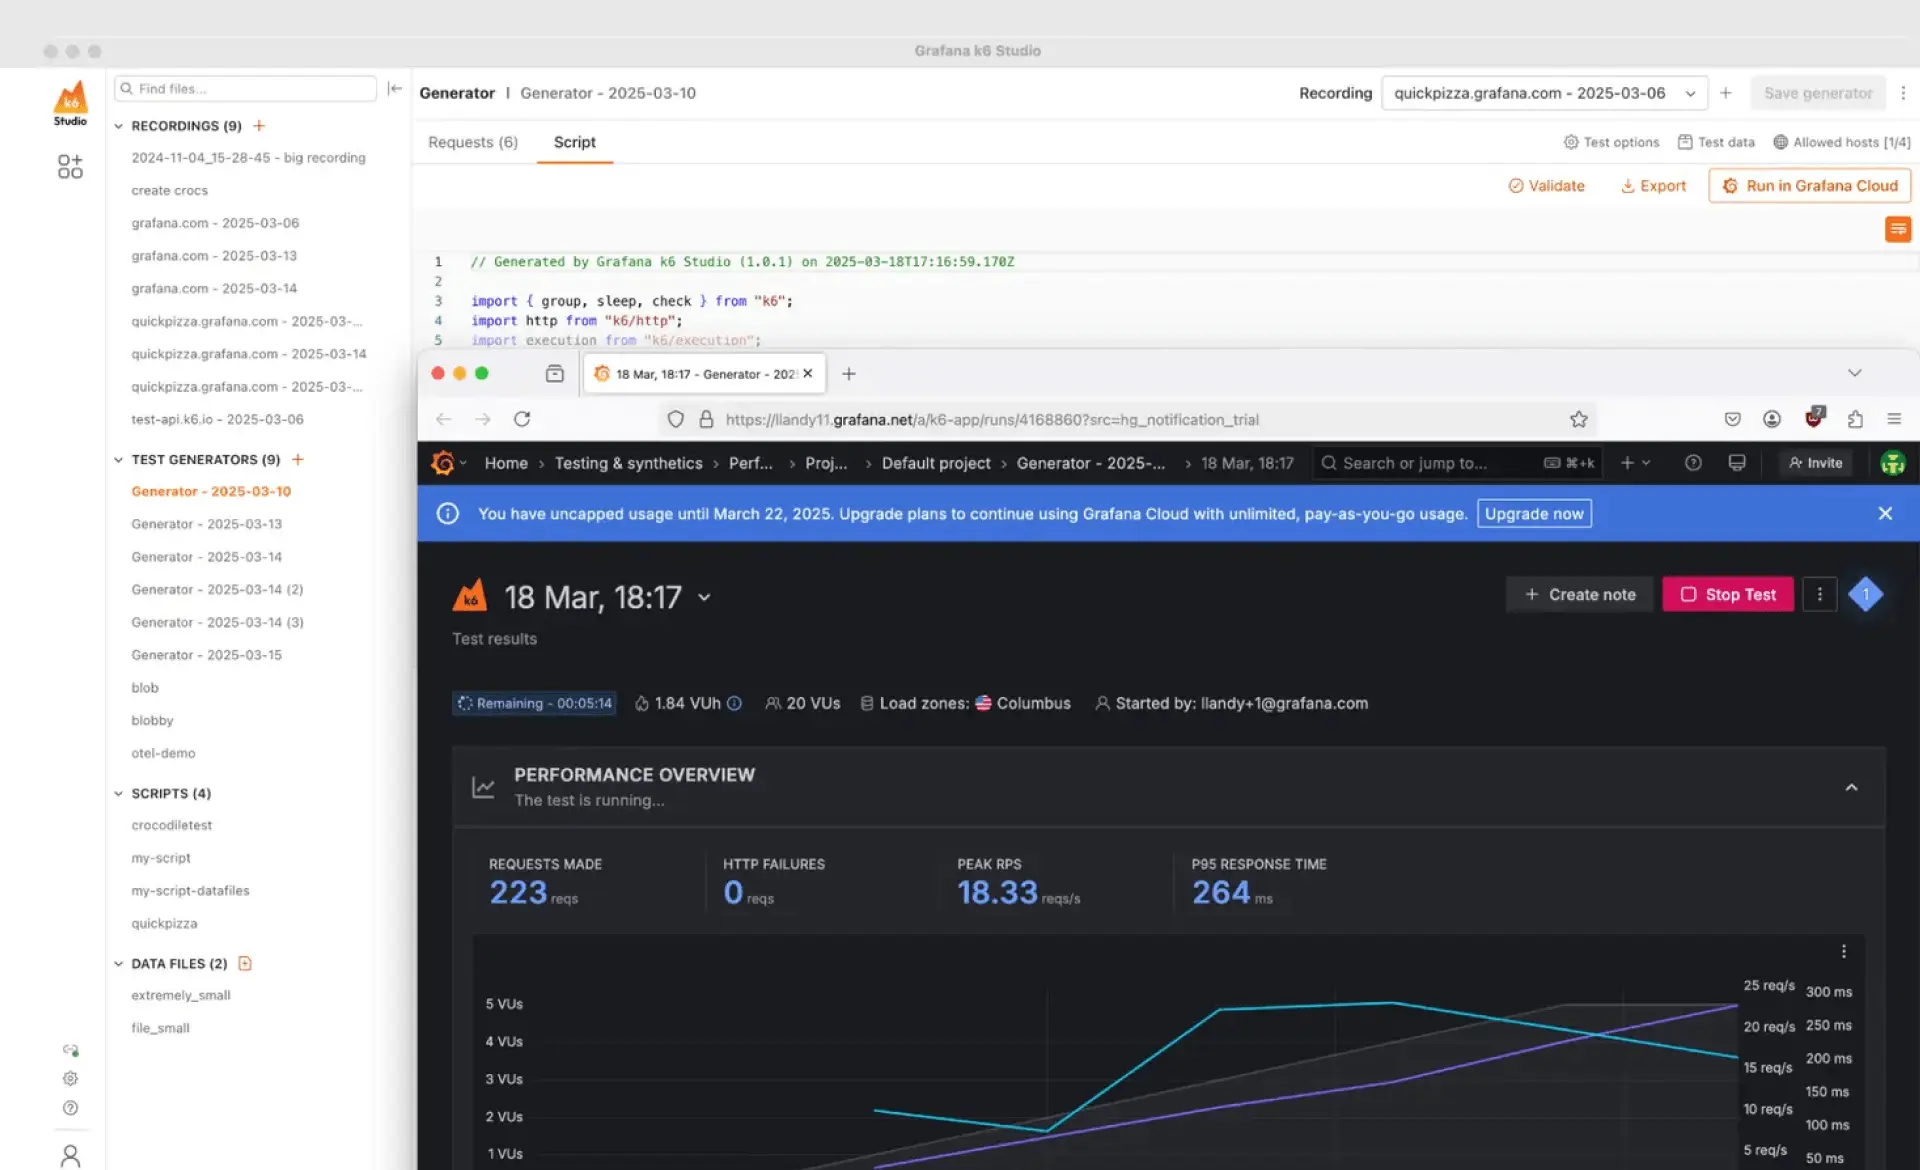
Simplify test creation
Tests can be created quickly by converting user flows into scripts using k6 Studio. Real user journeys can be recorded, refined, and executed in Grafana Cloud or locally using k6. Scripts can also be visually edited and debugged, making it easier to validate test logic and behavior during development.
Combine frontend and backend performance testing
Browser-based testing with the k6 API simulates real user interactions such as clicks, typing, and navigation while capturing performance metrics. Protocol-level and browser-level tests can be run together to provide a complete view of application performance. Test results include Web Vitals, interaction timelines, and screenshots to support faster debugging.
Run scalable cloud tests
Performance tests can be executed globally from more than 20 geographic regions using Grafana Cloud. Private Load Zones allow secure testing of internal systems, while cloud infrastructure supports large-scale load scenarios with high concurrency and request volume for stress validation.
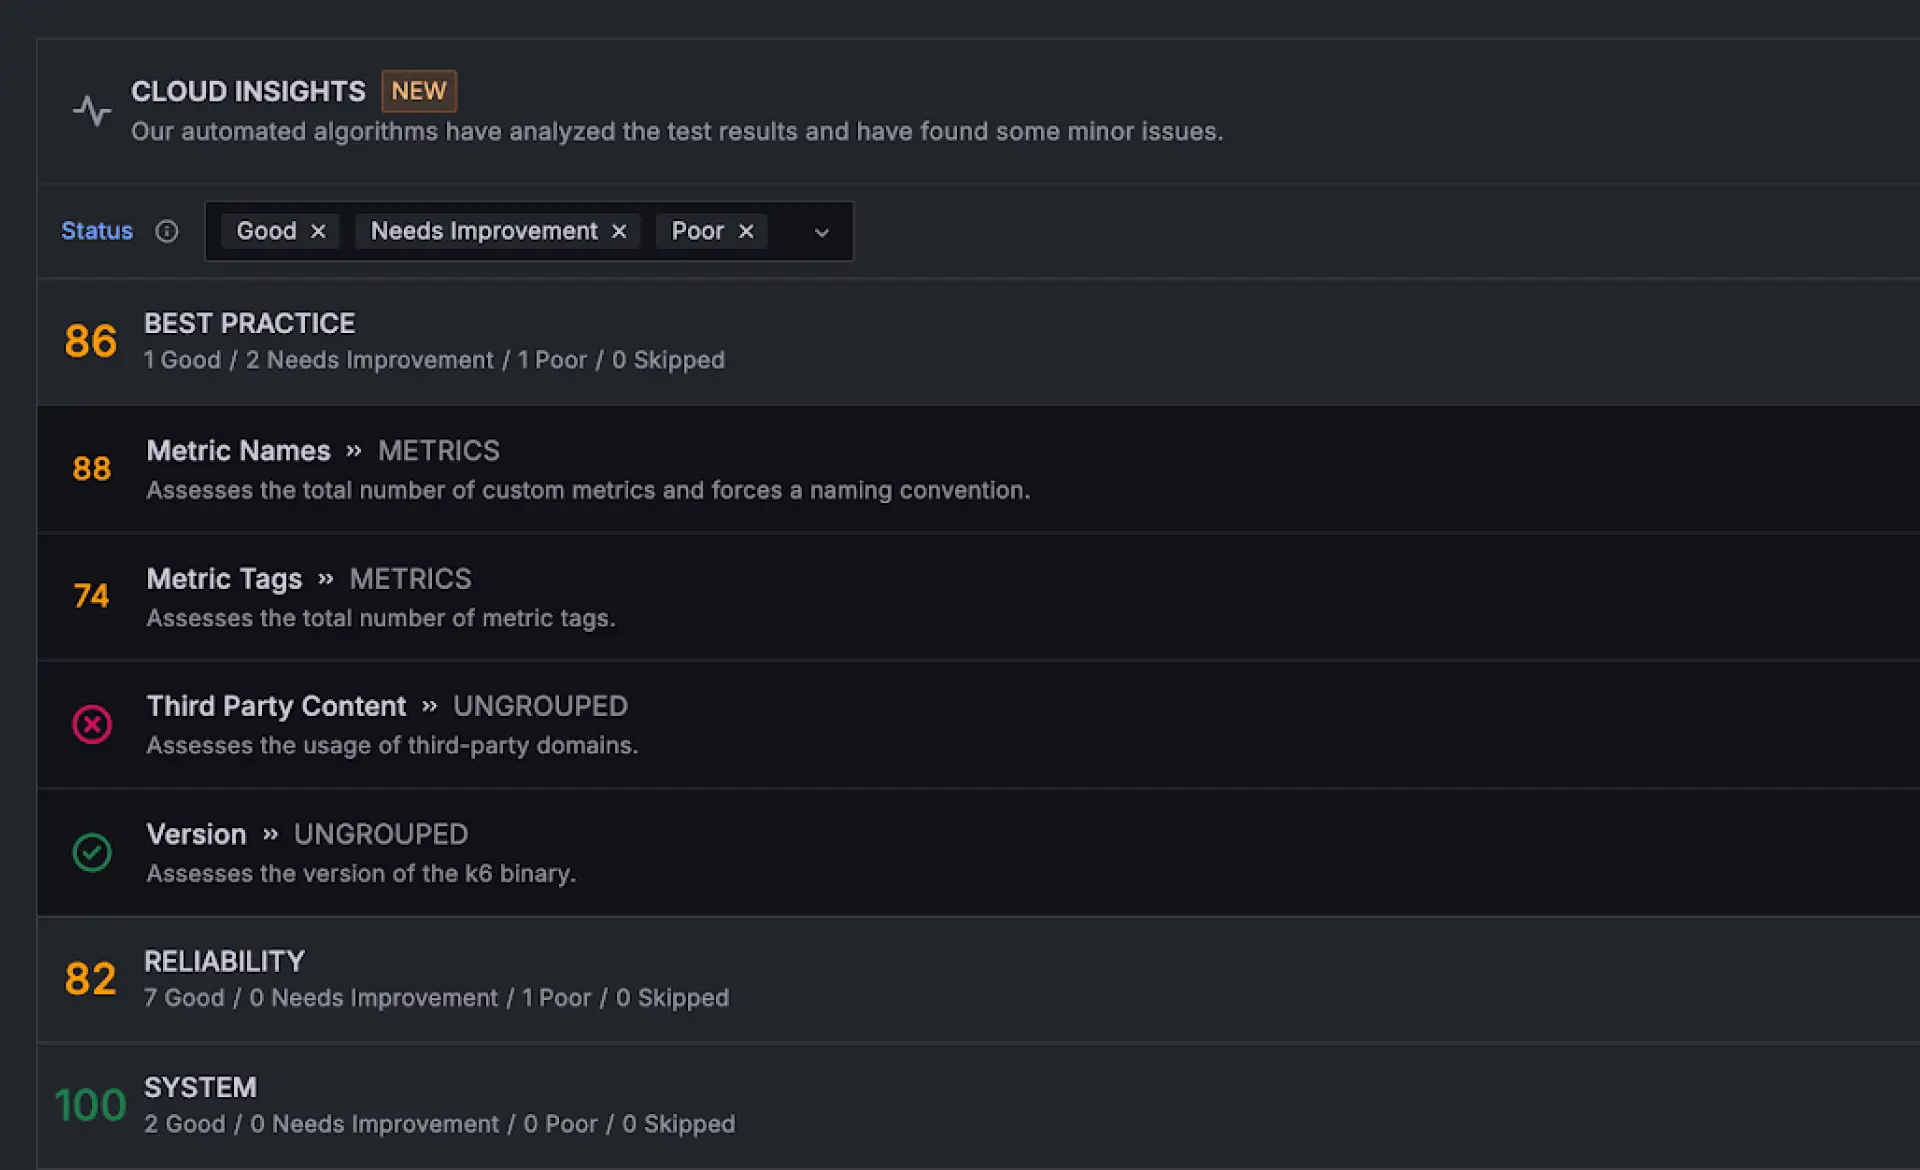
Analyze performance test results
Cloud Insights highlights performance issues automatically and compares results across test runs to detect regressions over time. Teams can explore results directly in Grafana Cloud dashboards and add k6 visualizations to existing observability views for continuous monitoring of performance trends.
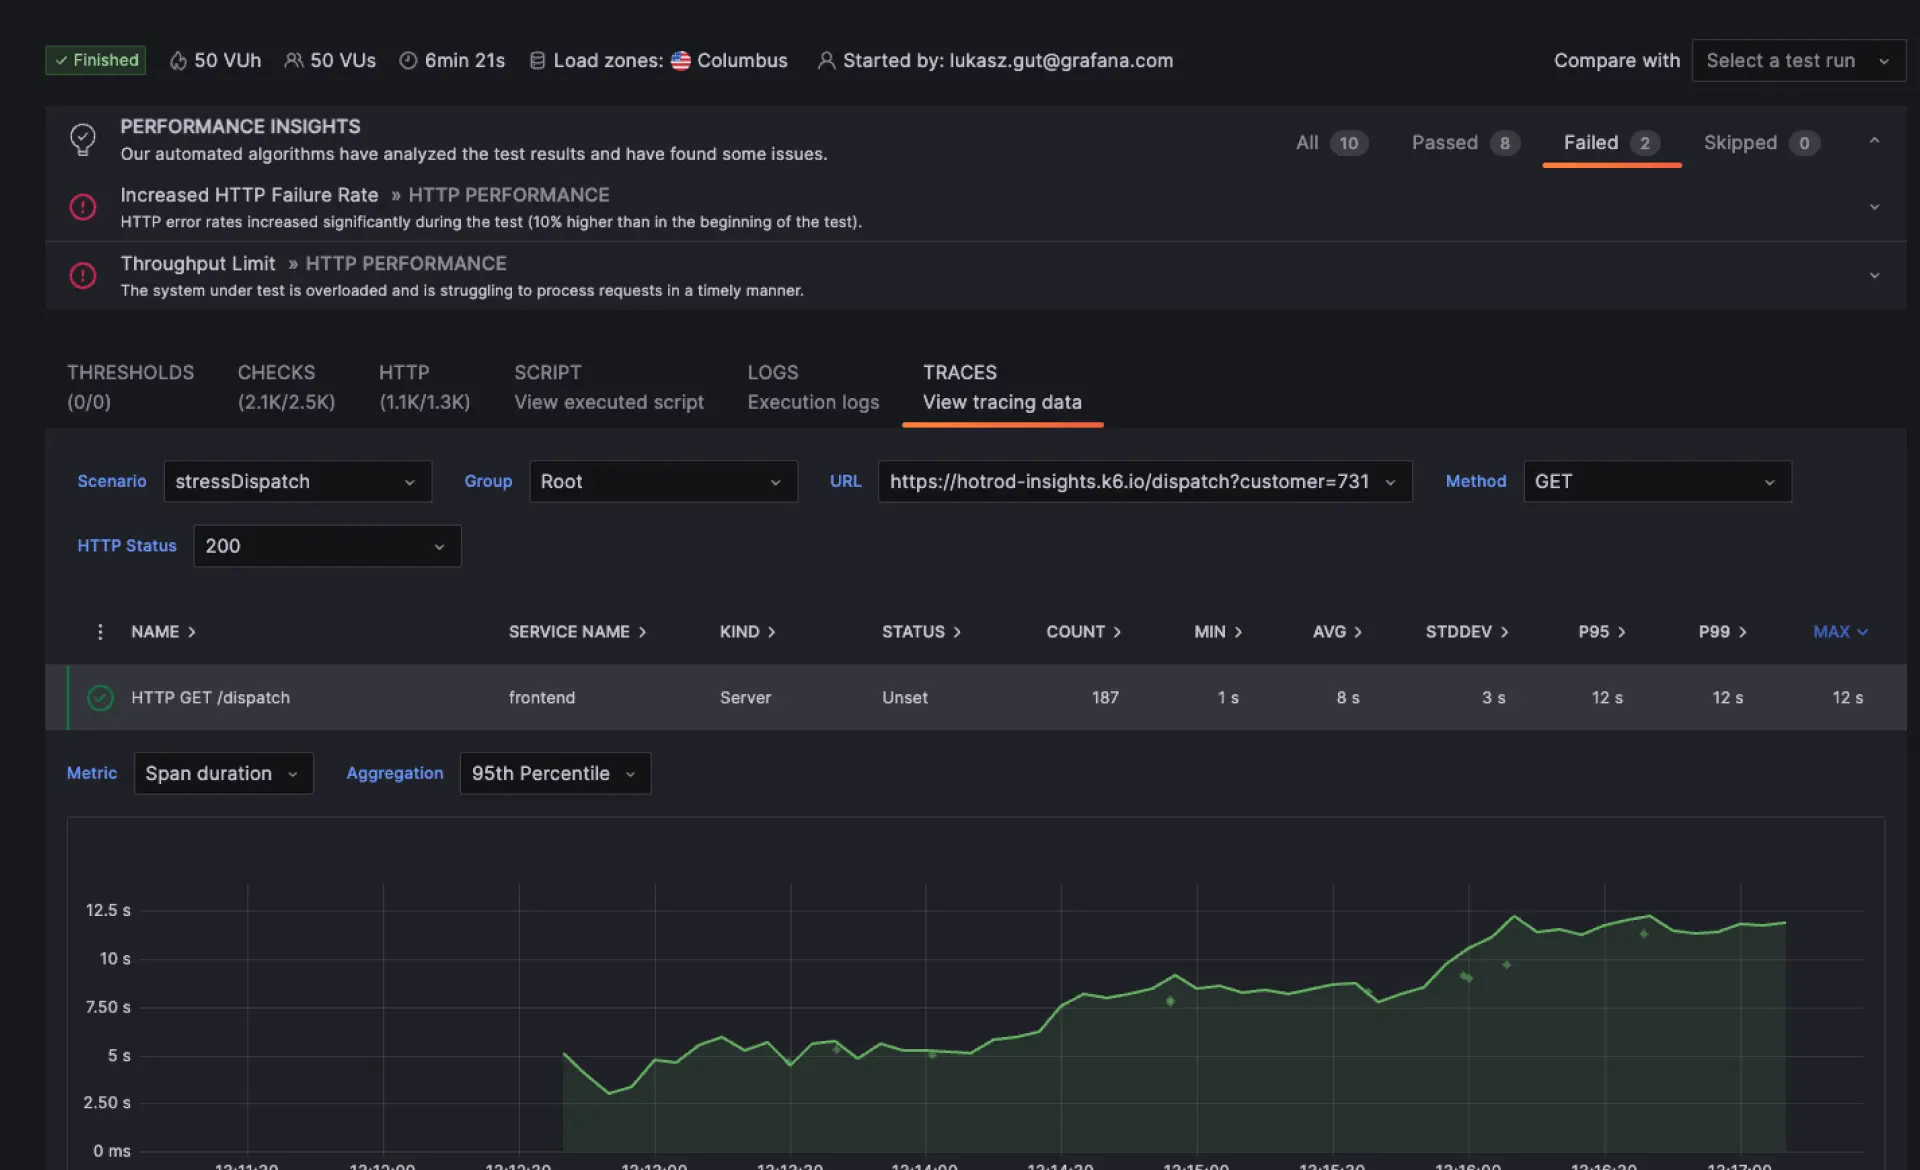
Correlate performance testing and observability
Performance test results can be analyzed alongside metrics, logs, traces, and profiles inside Grafana Cloud. This allows teams to move directly from test outcomes to root cause analysis and identify system-level bottlenecks without switching tools.
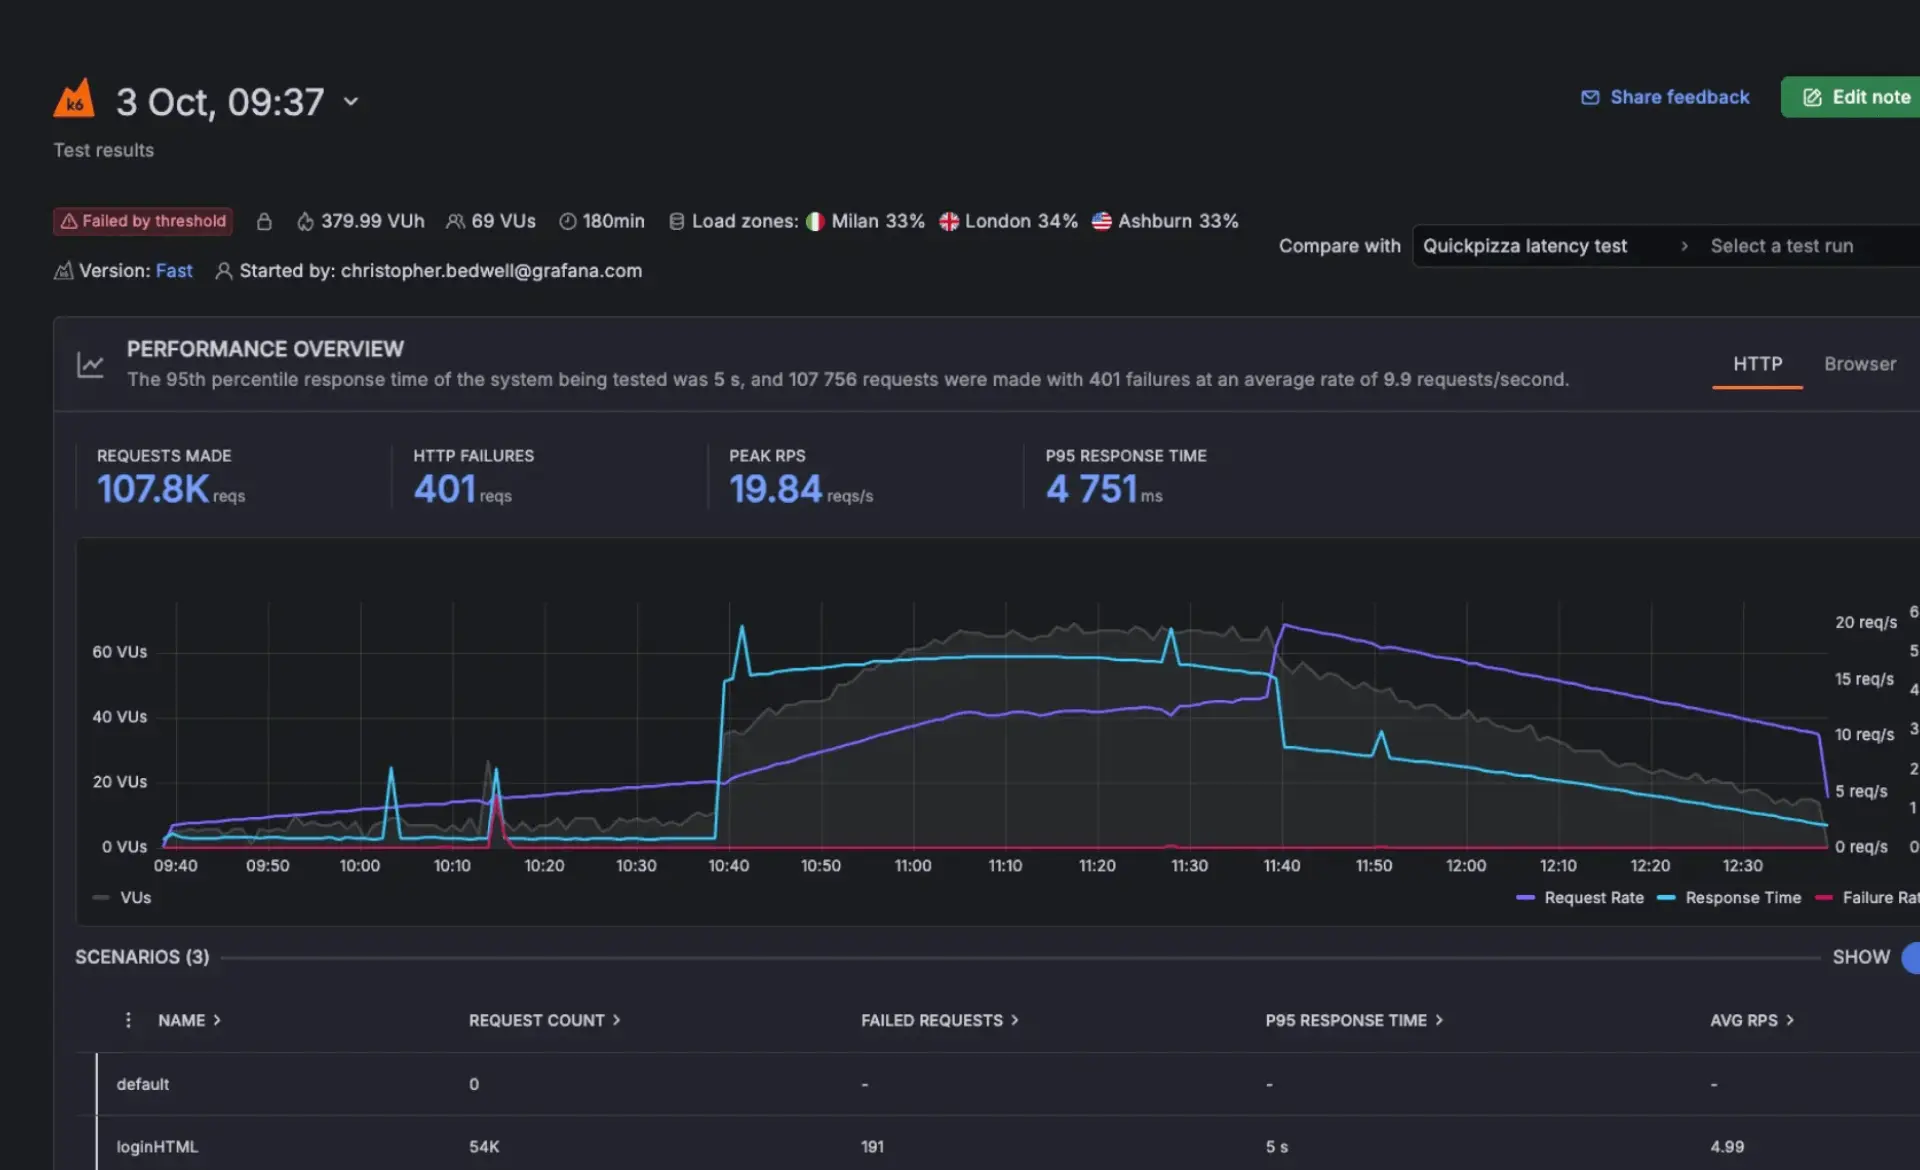
Performance & load testing | Test system limits before users do
powered by k6, Grafana helps teams simulate real traffic and measure how systems behave under load across APIs, services, and user flows. Tests are written as code and can be run as part of CI/CD pipelines to validate performance before releases and detect regressions early. Results are analyzed alongside metrics, logs, and traces in Grafana Cloud, allowing teams to connect load behavior directly to system performance and quickly identify bottlenecks under stress. Consultants from amasol help teams design meaningful load tests, integrate them into development workflows, and ensure results are actionable.
Grafana key capabilities
AI-powered observability
Use AI to surface anomalies, patterns, and relevant signals across your telemetry data, helping teams detect and understand issues faster.
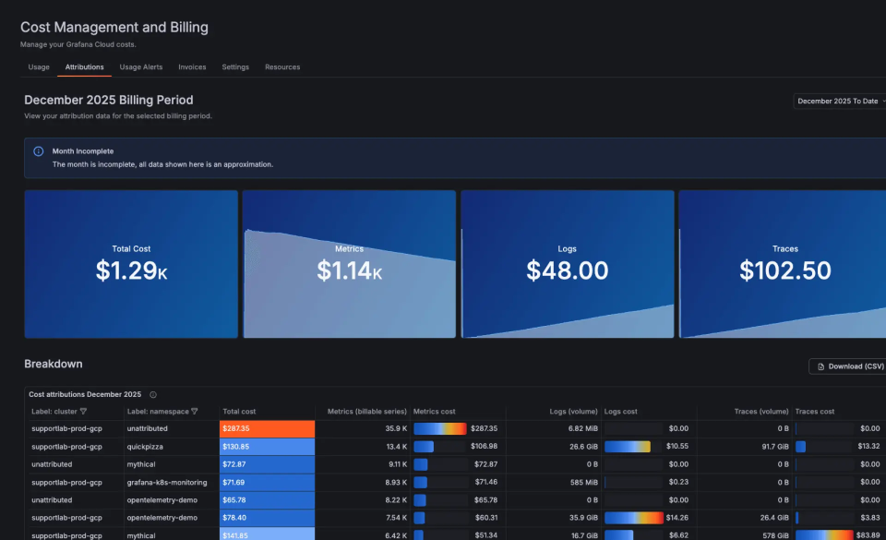
Cost management & optimization
Reduce observability spending by controlling data volume, filtering noise, and focusing on high-value signals across metrics, logs, and traces.
Data correlation & root cause analysis
Connect logs, metrics, and traces to uncover dependencies and quickly identify the root cause of performance issues or system failures.
Native OpenTelemetry support
Ingest and process telemetry data using open standards, ensuring flexibility, portability, and seamless integration across environments.
Security & access control
Protect observability data with role-based access, fine-grained permissions, and secure data handling across teams and environments.
Governance & compliance
Maintain control and auditability over telemetry data to meet internal policies and external regulatory requirements at scale.
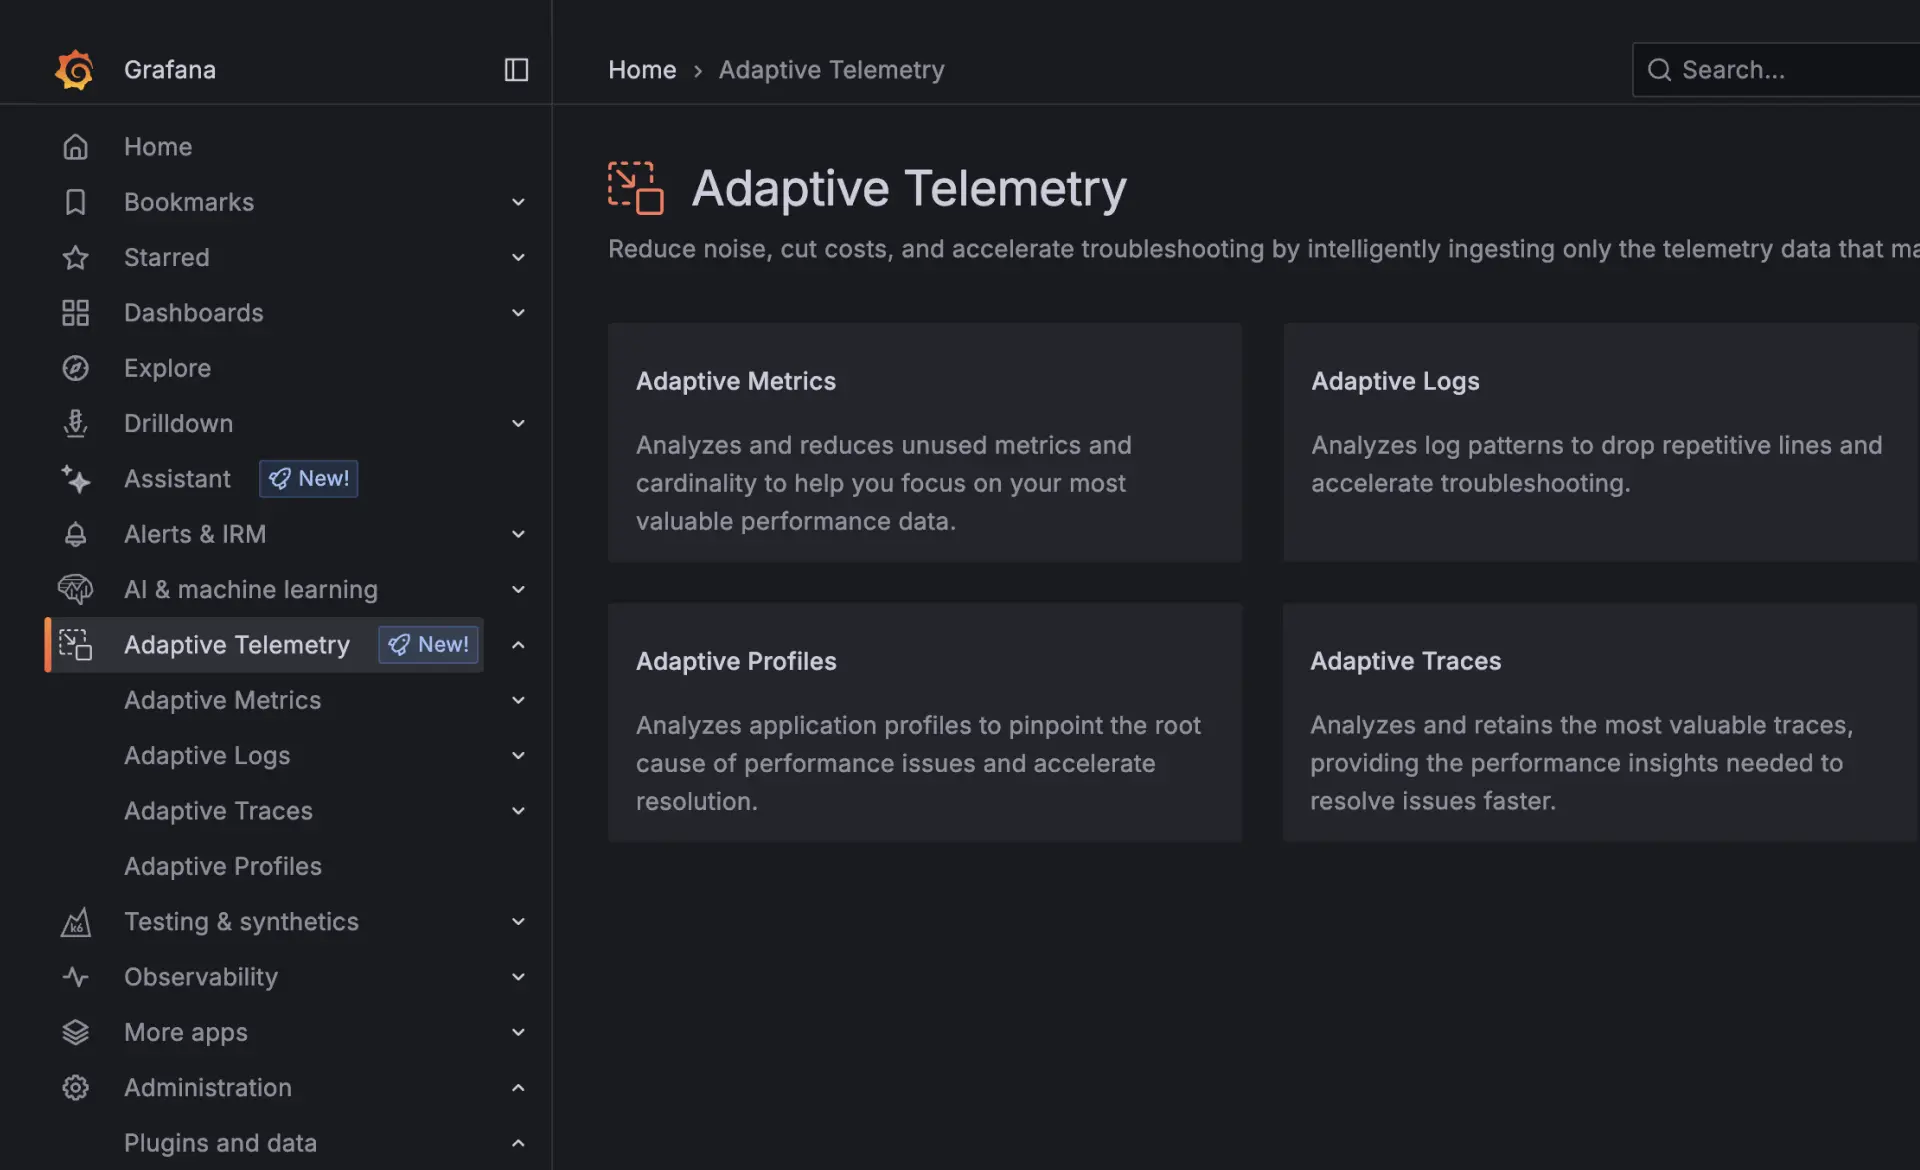
Adaptive telemetry | align observability cost with value by reducing low-value data and keeping critical insights.
Most organizations struggle with rapidly growing observability data that increases cost without improving insight often referred to as the observability tax. Adaptive Telemetry addresses this by analyzing how teams actually use their telemetry data and identifying signals that provide little or no value. By applying usage-based insights, it helps reduce unnecessary data volume through smarter aggregation and filtering, ensuring critical signals remain visible while minimizing noise and cost.
At amasol, we work closely with your teams to translate these recommendations into practical implementations within Grafana Cloud. We help validate what data is essential, what can be optimized, and how to maintain control over your observability environment while improving efficiency at scale.
Adaptive metrics
Optimizes time-series data by identifying and removing unused or low-value metrics through intelligent aggregation.
Adaptive logs
Reduces log volume and cost by filtering redundant or low-signal log data while preserving meaningful insights.
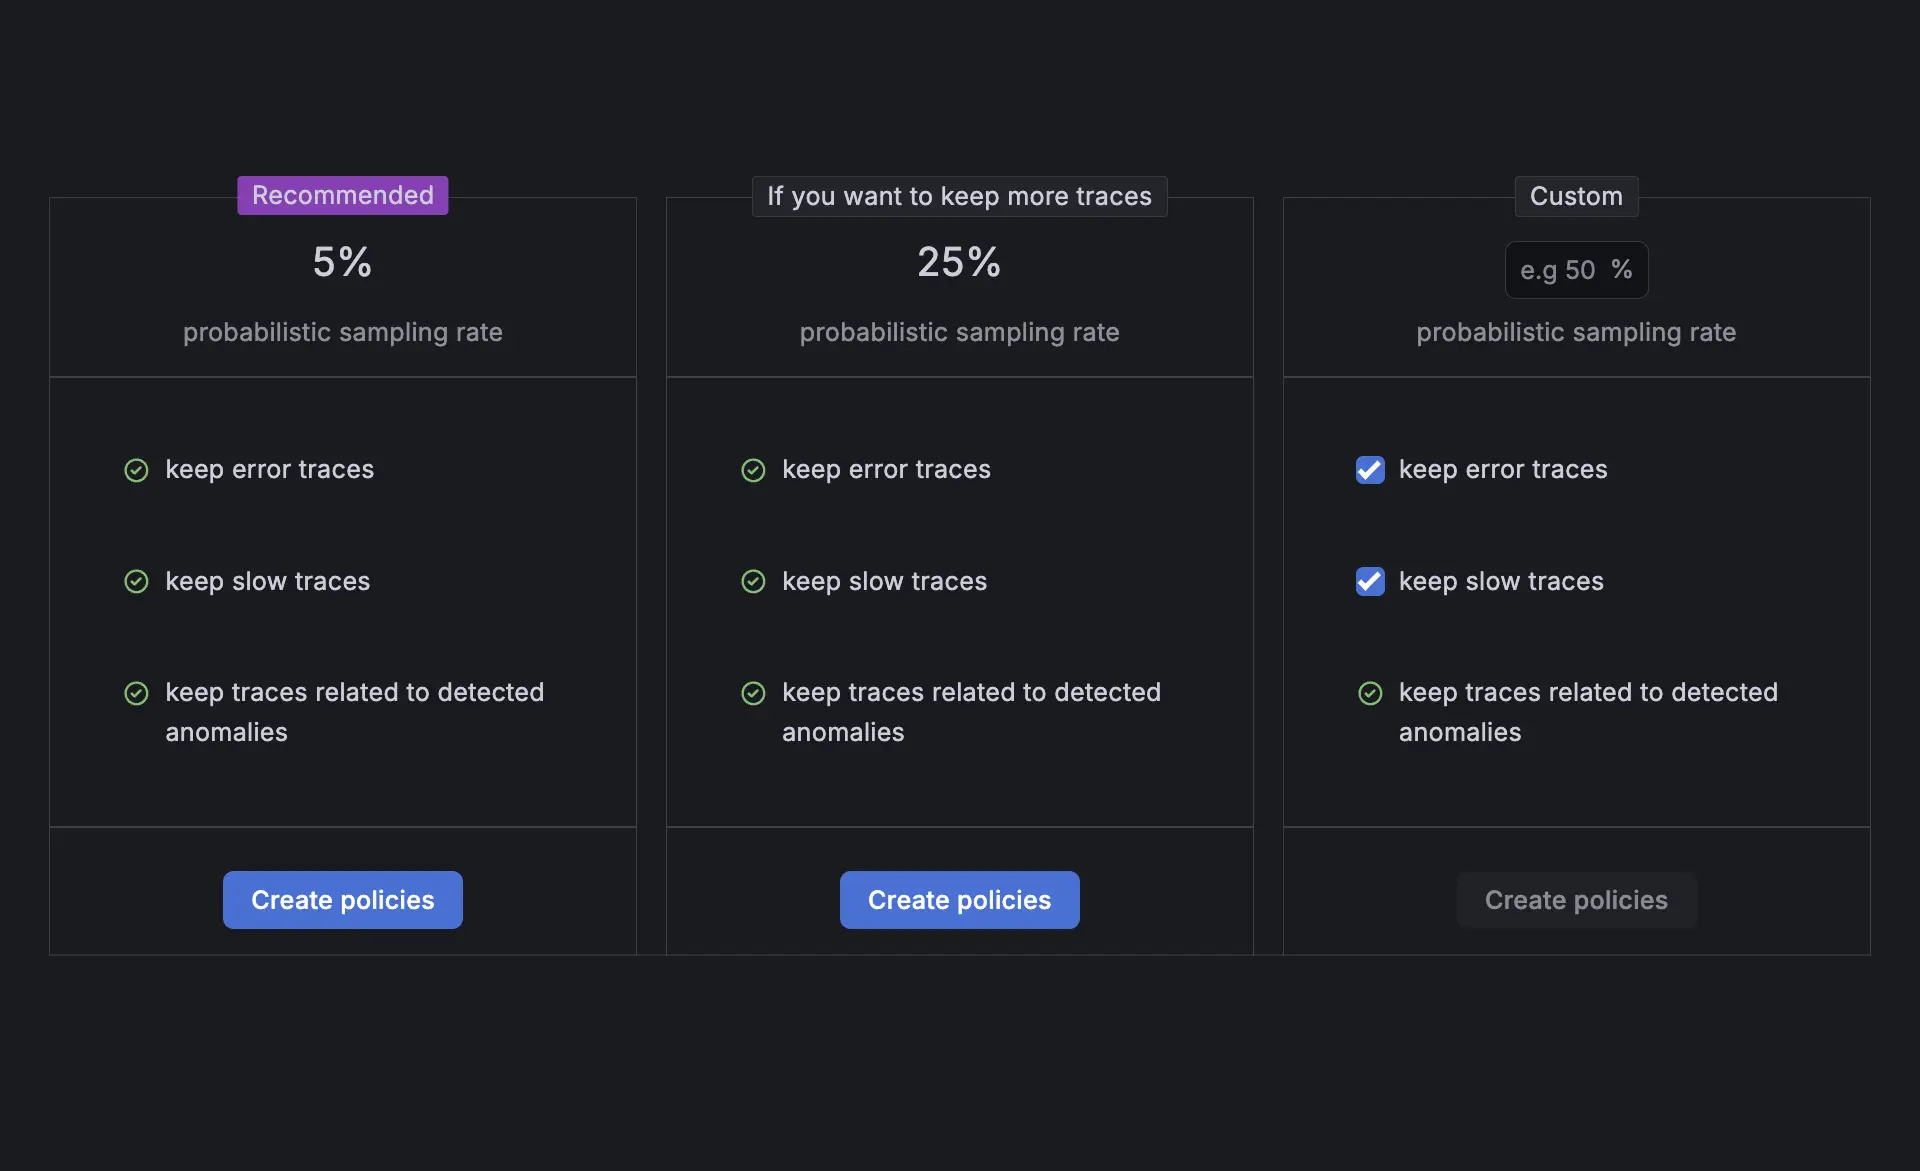
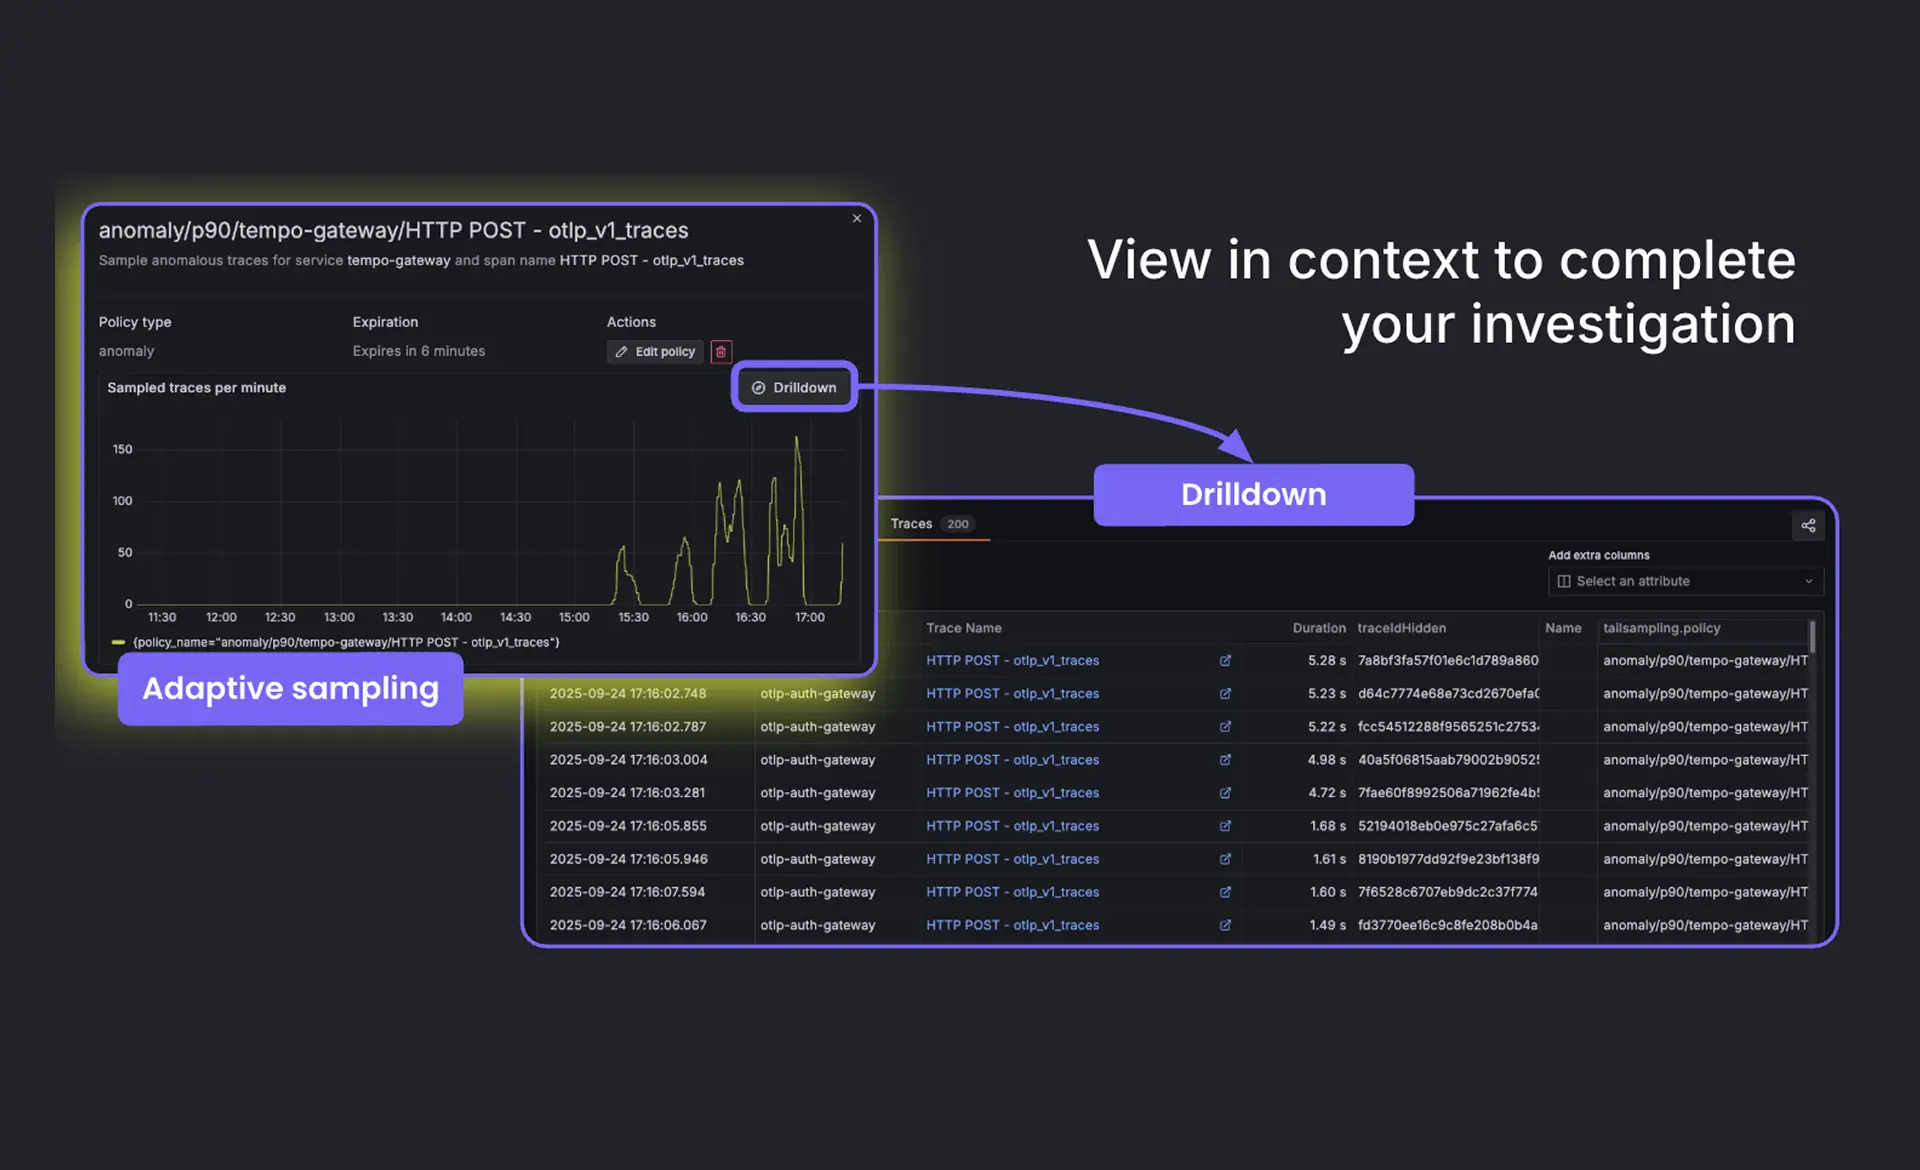
Adaptive traces
Retains high-value traces by identifying relevant patterns in distributed tracing data, improving performance visibility while controlling storage costs.
Get more information on Grafama
You can leave us your details and we will get back to you, for an initial non-obligatory first contact.
Grafana blogs

Our expertise
Benefit from over 25 years of deep expertise and high-quality service delivery across our key areas
Resource center
Search through our library of resources for inspiration on how amasol has helped other customers to power their experience business.
Why amasol
We aim to increase agility, increase the value proposition and improve the efficiency of IT and thus increase business success.
Our events
From expert discussions to hands-on workshops, we connect strategy with technology.Discover more

Schenker relies on Dynatrace and amasol for user experience monitoring and application performance management in the air and sea freight sector
Dynatrace’s comprehensive support for modern cloud, on-premise, and hybrid environments also ensures scalability and long-term adaptability. The result is a more reliable, cost-effective, and easier-to-manage observability solution compared to fragmented systems or less integrated deployments.
Dynatrace & amasol: Stronger together
85% of technology leaders say the number of tools, platforms, dashboards, and applications adds to the complexity of managing a multicloud environment. amasol simplifies IT operations, enhances performance, and drives seamless business continuity with our unified observability solutions.
Dynatrace & amasol: Stronger together
Dynatrace provides valuable insights into your IT processes. amasol connects the dots between your business requirements and IT processes.
Successful registration to our Exeon Workbench
Good day,
thank you for registering for the Workbench | Threat detection with AI-based behaviour analysis.
Here is the most important information:
When: Tuesday, 30th of September 2025 | 10 a.m. – 11 a.m.
Where: Online via Zoom.
We look forward to your participation and to interesting discussions and presentations on the topic of Detectability.
Kind regards
Laura Ilgner
You will receive a reminder email from us one week before the event.
Lorem ipsum dolor sit amet, consectetur adipiscing elit. Ut elit tellus, luctus nec ullamcorper mattis, pulvinar dapibus leo.